





Evaluating Power Query Usage in Microsoft Excel
Is Power Query a viable component in a fully automated Microsoft Excel 365 Solution for Business?
If so, in what capacity? How far do you take Power Query; how do you leverage its POWER.
Let’s find out, via a few examples
What is Optimal Usage of Power Query in Microsoft Excel 365

In our Power Query example, you can go directly from a series of Excel Tables, to a Pivot Table, via Power Query, only showing the desired/filtered data. No user intervention or effort needed. This is the POWER of Power Query, Automation.
At Excel and Access, LLC we build
“Relational Solutions within Excel 365, w/ Power Query, for Business.”
877-392-3539
Your Data is in Excel Tables, Great, Now What?
For this post, and for the examples, we assume your data is in Excel Tables. That is the starting point for every Excel project.

Excel Tables and Excel Ranges are not the same thing, you would benefit greatly from working with Excel Tables.
Using Your Data: Great, your data is in proper Excel Tables. Nice work. Now how do you access it, how do you reference it, how do you manipulate it, and how do you share it?
You have many options here, which do you take? 1. Legacy Functions, 2. Dynamic Array Functions, 3. direct-cell-references, 4. links, 5. Macros, 6. Joins, 7. Queries, 8. Forms, etc.
The methods you choose mostly depend on if you are an old-school, new-school, or hybrid/fusion/complete Excel developer. We recommend that you start with the new tools, and then fill in the holes with the older tools.
Do you leverage the newer tools ( Dynamic Arrays ), such as the GROUPBY Function, or perhaps, Power Query, or do you write columns and rows of legacy functions, such as the VLOOKUP, or INDEX/MATCH?
Which would the client want in their custom solution, if they were Excel 365 experts – if they knew? Is this the best solution?

Using Your Data: Is Uploading Your Excel Tables into Power Query Optimal?
In this post we will focus on the benefits of using Power Query over other methods, as such we will do several comparisons. Is Power Query up to the task of providing a robust Excel solution for business?
This post: Power Query over traditional formula-based methods, which is optimal; How far can we take Power Query, in an Optimal solution.
How far can we get in Power Query so that we do not need to base the solution on onsheet calculations, either Legacy or DAF or macros. Can we do most of that in Power Query without having a negative impact on performance?
Or will the use of Power Query actually enhance performance?
~ We will work through several examples on your options ~
- Power Query Example
- Legacy Functions Example
- Dynamic Array Functions Example
- Hybrid Example
Note, we are talking about Excel files that do not exceed 10MB in size.

877-392-3539
Power Query Example
Below you will see the use of Power Query, taking data straight from three Excel data Tables, up into Power Query, generating a series of Queries, which provides all of the Reports and Analysis.
In this example, there is no user needed, no macros needed, no onsheet calculations needed.

Power Query Variance Report. Zero use of OnSheet Cals, as the simple subtraction was done in Power Query.
In this example, it is all Power Query based; there are no onsheet calcs. In this example, the User does nothing; the file AutoRefreshes on open, and every X minutes. If the data in any of the three Excel data Tables changes, the output will change, no user needed.
Yes, this is a simple example.
The data starts with three local Excel Tables
Three internal Excel Tables are used to store the data. Budget, Forecast, and Actuals. Each Table has the same format, only the data in the Source and Sales Columns is different. These could easily be external Excel Tables, it would not change the solution, other than making it more dynamic.
The three Excel Tables are loaded into Power Query, saved as Connection Only.
The three Queries are Loaded into one Query. Now all of the data is available in one vertical Query / Table.
That one Query is then the basis of all other queries, providing Pivot Tables, Pivot Charts, and Power Query Report Tables.
That is the solution, data flows from the Excel Tables to the output, no user needed, no formulas needed, no macros needed.
Yes, this is a simple example.
Three Excel Tables have the Data
The Tables can be internal or external, it really makes little difference. The main difference is how the Power Query will refresh online versus the desktop, but that changed recently. Hopefully they will continue to simplify that online.

We have three Excel Tables as the data source, they can be internal or external, it makes no difference to Power Query.
Power Query Table with Combined Data
Like data should go in a single Table, for easiest results. Why have formulas look at three different Tables, when it can look at one. The Source Column makes that possible. Simple is better.

Simplicity through design.
Power Query Pivot Table
Power Query can send the results directly to a Pivot Table in Excel 365, and soon Pivot Tables will automatically Refresh. Why take the time to load the Table to a Tab, and then build a Pivot Table off of that; do it directly out of Power Query.
Minimize the effort of the user, minimize formulas, minimize macros, use Power Query.
Power Query Pivot Chart
Same for Pivot Charts, straight out of Power Query. Automation is easy with Power Query, you can always some Macros/Scripts, and DAF’s as needed.

If you must send data to Charts, why not use Pivot Charts via Power Query?
Power Query Report
We love Power Query Reports, in the Table format. Load the results to a sheet, not calculations. We do not need to populate hundreds of thousands of cells with formulas, formulas that may need to be updated, or copied down, or even broken by the user.
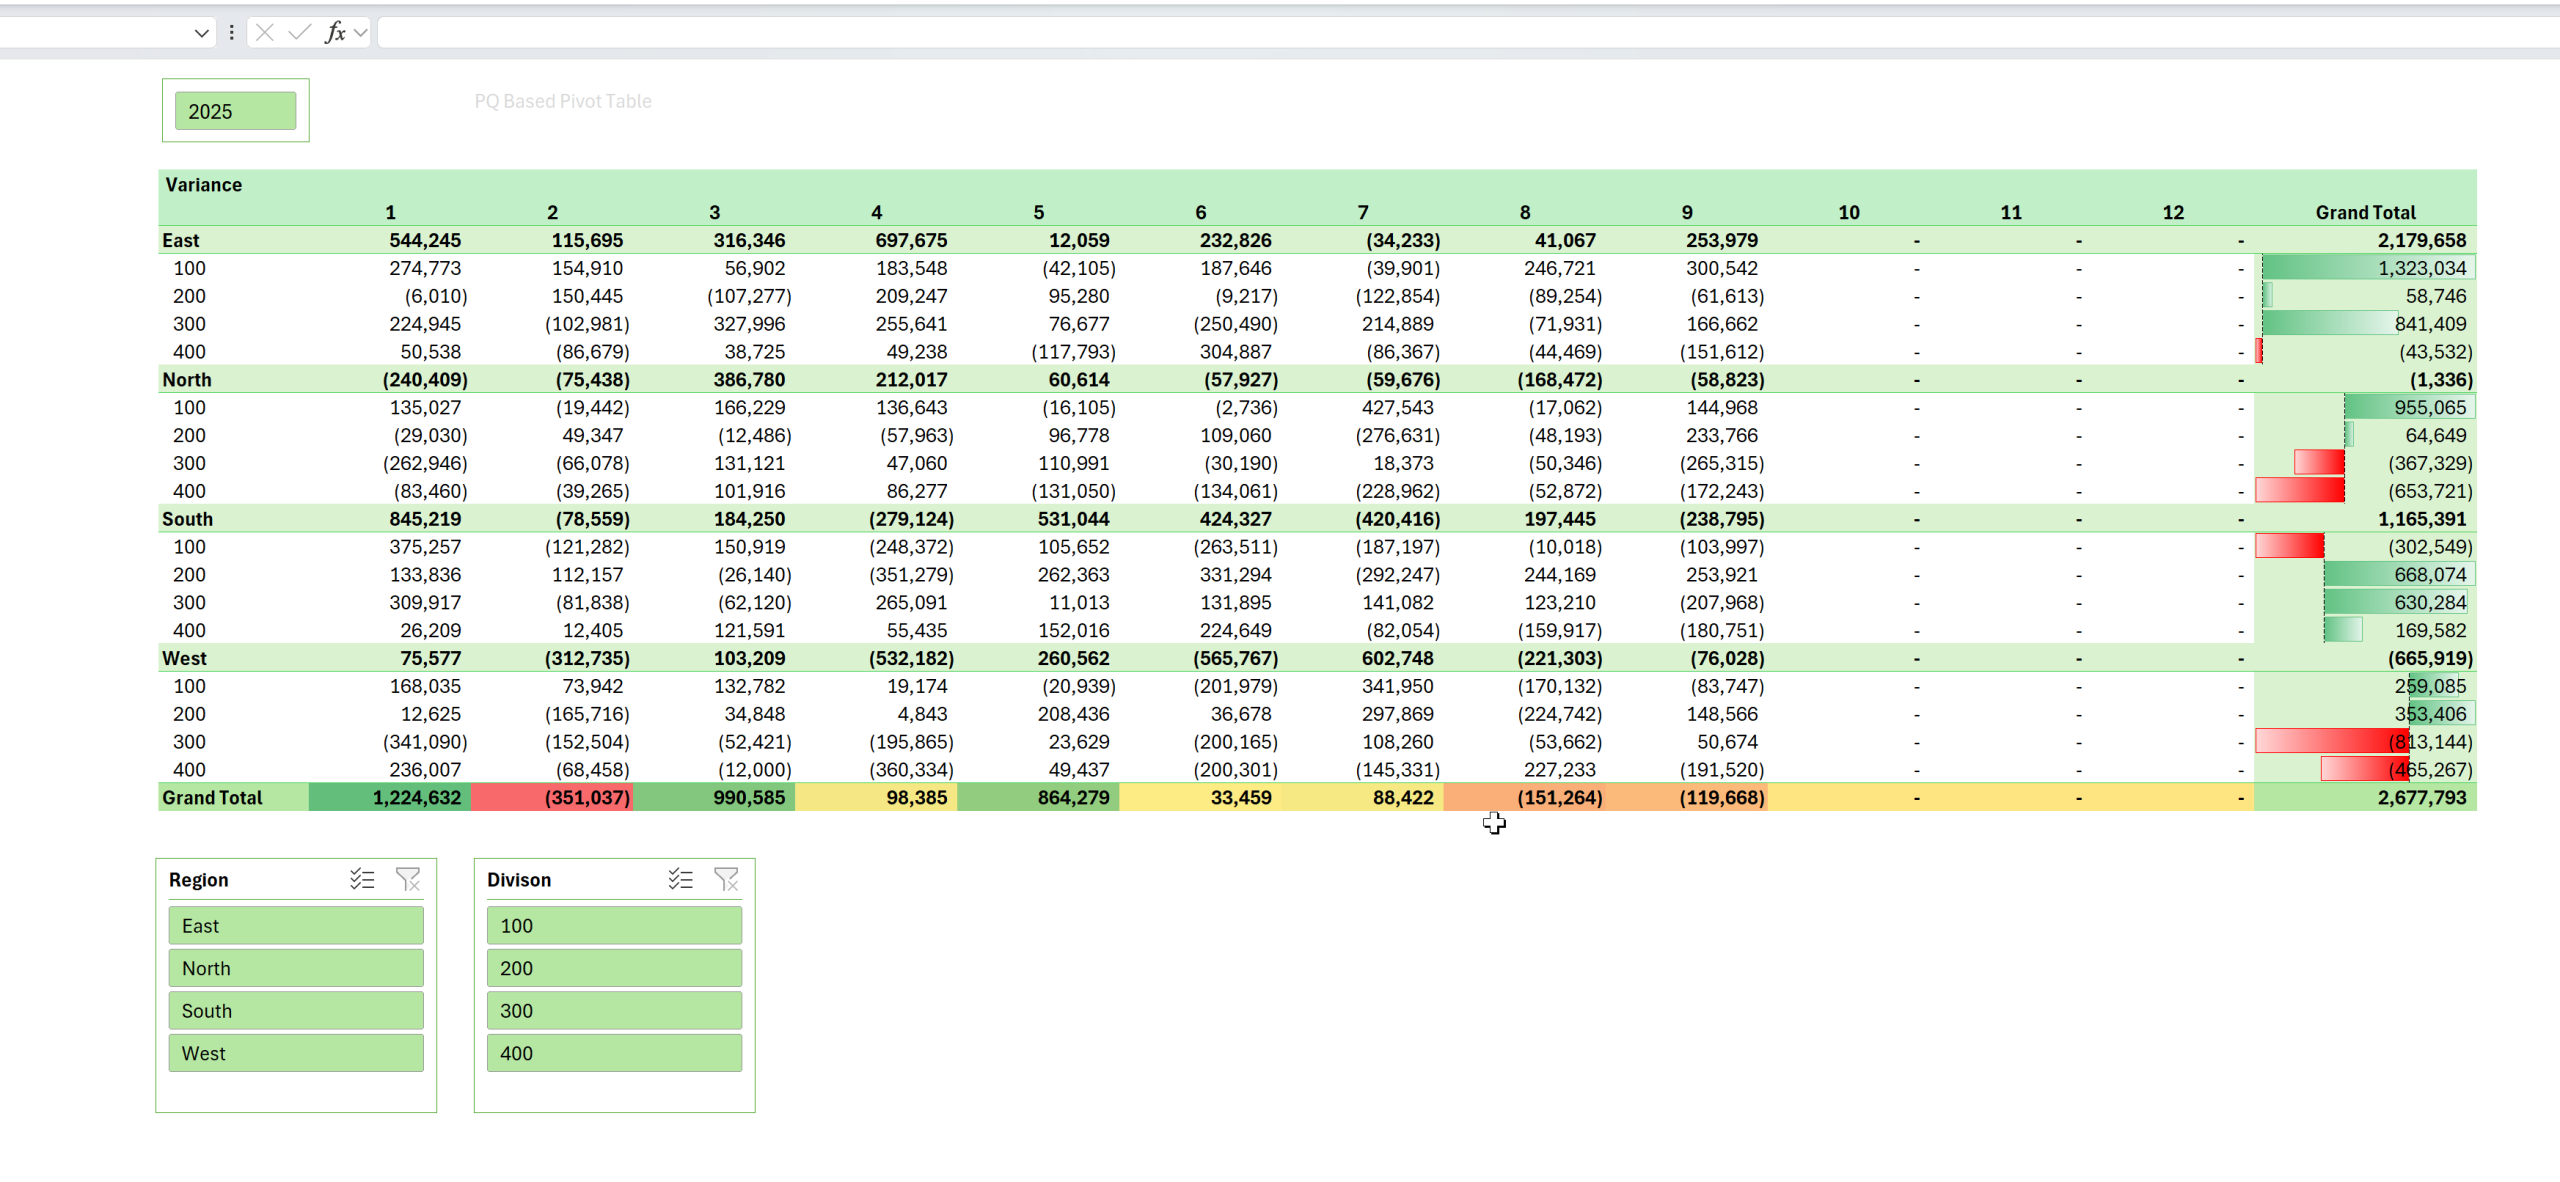
Add Slicers, make it interactive.
Reports are usually in a tabular format, usually pulling from multiple sources, perfect for Power Query Reports.
Power Query Pivot Table with Slicers
This is powerful, Pivot Tables based on Power Query output. Saves a step. And if you have not heard, soon Pivot Tables will AutoRefresh.

Pivot Tables, Pivot Charts, Slicers, those are the center of many Excel Dashboards. To simplify the solution, base it on Power Query.
Power Query Editor
This is where the fun is. It might look intimidating, but Power Query is easy to learn. Much easier than learning the PIVOTBY Function.
Much of what is done here is via the mouse, point and click.

I can teach someone how to use Power Query faster than Excel functions. Power Query is intuitive, and easy to program, at the intermediate level.
Power Query Editor Showing Calculations
Here we do calculations in Power Query, instead of onsheet. We send the results, results that can be refreshed. We do not have formulas to maintain, protect, etc.
Why would you want to write formulas against the Budget Table and the Actual Table onsheet? That could be tens of thousands of cells with formulas, maybe more. What is the advantage?
So in this post we want to see how far we can push Power Query, in a business setting.

OnSheet versus OffSheet, where do you want to perform your calculations? Which is more efficient.
Advanced Automation without VBA
You can do a lot of automation simply by using Power Query. If you wanted to take this simple sample solution to another level do this:
- Place each of the three data files on SharePoint/Teams.
- External data files.
- Place a PQ Path Selector tab in the workbook.
- Use the EOTG Add-In.
- Set the workbook to AutoRefresh
- Set the workbook to RefreshAll on Open.
- Set the workbook to RefreshAll every X minutes, to get the latest updates.
- Automate all user actions, such as picking a month or date, programmatically.
- Use a Periods Table.
- Add Code:
- If desired, M-Code, Macros or Office Scripts, to enhance the user interface, not to manipulate the data.
- This file is then basically disposable, as all of the data is in external files.

M-Code is the next frontier in Excel programming at the expert level.
Is Power Query a viable component in a fully automated, integrated, interactive, Microsoft Excel 365 Solution for Business?
Using Dynamic Array Functions
In this example, we will use only Dynamic Array Functions and Excel Tables. How easily can we produce the same output, without user intervention, using DAF’s? Probably just as far as within Power Query.
 Dynamic Array Functions are the top functions in Microsoft Excel 365. Mastering them is important.
GROUPBY, PIVOTBY, CHOOSECOLS, FILTER, LET, LAMBDA, these lead the effort in Range-Based programming ( Array-based programming ). Look at the power in the two newest and clearly most powerful functions in Excel to date, 10+ parameters!
The Microsoft Excel 365 GROUPBY and PIVOTBY Functions Produce an Entire Report, in one function, Headers, Totals, Sorts, Filters, etc.
One Cell, One Dynamic Array Function, One Report.
The whole point behind the new dynamic array functions is to simplify Excel programming. The DAF’s do just that. The two latest, they take it to all new levels, one function produces an entire report.

Comparison between PIVOTBY Function and a Pivot Table.
Once the Pivot Table auto-refreshes, it will work much like the PIVOTBY Function, as both will refresh with the data. The main difference will be the way that the user interacts with the two methods of Pivoting data.
Still, we use both methods, plus the Power Query Pivot Report method in all of our custom Excel 365 Dashboards.
Or do you Pivot in Power Query?
Dynamic Array Function Example ( DAF )
If you are going to use onsheet Excel functions, start with the dynamic array functions ( DAF’s ) in Excel 365. If you cannot do it with those, then reach for the Legacy Functions.
But do try to use the newer functions first, and if you do in fact need to use the Legacy Functions, make sure to make them dynamic, through advanced use of those functions. Force your Legacy Functions to Spill.
Examples built by Jeff Stevens at Excel Forge Solutions. LinkedIn, Website.

Jeff is a master when it comes to the DAF’s. One of the best in the business.
Example of Excel 365 Dynamic Array Functions in Use
This is one complicated formula. Look at the functions used, impressive.

Jeff Stevens knows DAFs at the expert level.
Dynamic Array Functions for Reporting and Analysis
Jeff’s example is very nice, very complex, so easy to use.
Look at the function, that is the future of Excel, at the expert level.
Write the function, place it in one cell, and then forget about it. It will ( Spill ) grow and shrink as needed.
Add the use of Slicers, very powerful. This is how Excel 365 is done.

Looks like our Pivot Table example, but this is not a Pivot Table, this is a DAF.
A Pivot Report, Pivoting the Data Source. This also feeds the chart.

Automated Excel solution using Tables and Dynamic Array Functions. Jeff Stevens.
LET, LAMBDA, it does not get anymore advanced that that.
Look at that LET Function. It goes in one cell. It does so much.

The section above was programmed by Jeff Stevens, a leading Excel expert, one who specializes in DAF’s and PQ.

Jeff knows the Dynamic Array Functions at the expert level. Tables, Power Query, Jeff does that too.
How to use DAFs in Excel 365 with Tables
So how would we use Dynamic Array Functions with Excel Tables? Without using Power Query, VBA, Office Scripts, or Legacy Functions?
One Cell, One DAF, Dynamic Results

The new PIVOTBY Function is AMAZING.
Legacy Function Example
Index/Match, VLOOKUP, massive amounts of VBA, direct cell references, external links, embedded functions, this was how Excel was done, for decades. Excel programming was very very messy prior to the changes starting in 2018, and it becomes less messy each time the Excel Team makes an update to Excel 365.
They know what they are doing; they know the future of Excel, it is very clear. Don’t be afraid, learning is good.
Hence the resistance.
I am not looking forward to building the tabs for this example. It takes so long to do all of that.
Conclusion – Evaluating Power Query in Excel 365
In Microsoft Excel there are always ten ways to do things, we all know that. But one of those ways works best, we do not all know that. At Excel and Access LLC we say go with the one that works best, in the particular situation, for THIS client. What works best for the client, not which method we prefer.
More and more, the online Excel experts are saying Power Query, Power Query, Power Query. Why are the Top Excel MVPs pushing the use of Power Query? Because it is so powerful.
Which was Easier to Program
In this simple example, Power Query within Excel 365 proved to be the quickest and easiest to build solution.
The second easiest was the Hybrid Example.
Thirdly would be the Dynamic Array example.
Lastly, the old-school methods.
Which is Easier to Use
The Power Query solution, in this example is clearly the one to go with; no user needed, no onsheet functions needed, just Refresh the file.
Second up would be the hybrid solution that uses PQ with DAFs.
Which do we Recommend
Power Query, Power Query, Power Query.
There are not that many calculations being performed with only 20,000 or so records; no need to complicate things.
We highly recommend the use of Power Query in all of your Excel 365 solutions.
The User Interface is Important, Very Very Important.
Hence the need for VBA on the desktop, and Office Scripts online, and M-Code in Power Query. Still, in our custom solutions, Power Query does 85% of the heavy lifting.
Why not leverage the use of Power Query; the world is not flat.
Below, select a Serial number, file Refreshes, push the White pencil to instantly append a duplicate record, or push the Black pencil, to edit the record, then append the revised data. Two uses, same Power Query Form, VBA makes it work.

A Power Query Table, being used to either Duplicate an Existing Record, or to Revise an Existing Record. The code makes the difference between the two, same Query.

This one simple Power Query Form allows the user to take four different actions against the Contact Table. Powerful, yet simple.
Is Power Query a viable component in a fully automated, integrated, interactive, user-friendly Microsoft Excel 365 Solution for Business? A solution where the User is often not needed.
Please, leave your comment, we want to know.
877-392-3539


Chris, thanks for letting me jump in on this project. It was fun to put some of those dynamic arrays and charting ideas into practice alongside your Power Query flow.
Really appreciate the generous shout-out here — and more importantly, the chance to learn from the way you set things up. Always inspiring to see how you simplify and automate.
Jeff Stevens
https://www.excelforgesolutions.com/
Helping Organizations Maximize Excel | Data Automation | Advanced Reporting & Dashboards | Consulting & Training
Jeff, I know many Microsoft Excel MVP’s that are not where you are in terms of leveraging the power of Excel 365 Dynamic Array Functions with Excel Tables and Power Query. Why do you think I ask you for help, send referrals, etc., you have talent sir. I recommend you and your firm.
Christopher