
Tables Beginner to Advanced
Tables, are still a largely unknown feature in Microsoft Excel development: Most Excel users have never heard of Excel Tables. Many Excel programmers still do not use Excel Tables. Fewer of those Excel programmers work with Power Query Tables. Luckily most have used or still use Pivot Tables.
- A handful of Excel Developers that work with PQ, build advanced Power Query Tables (Hybrid Tables ).
Tables are largely unknown, yet they are the foundation of a proper Excel solution.
Types of Tables in Excel 365
There are several types of Tables in Excel 365. They are listed below. Each works somewhat differently.
- Excel Table ( default is usually blue )
- Power Query Table ( default is usually green )
- Pivot Table
- Power Pivot Table ( Excel Data Model )
- PIVOTBY Function ( Dynamic Array Function )
- Important Note: Tables can do more than house data; you can use them as data forms.
Tables are how Microsoft Excel is programmed in 2026. If you do not use Tables, now is the time to reconsider that. Here we walk you through the various Tables in Excel 365.

Tables do more than hold data; Tables make great Data Entry Forms.
In this post, we will cover Tables in great detail
We cover all types of Tables, showing a variety of ways to use them.
- Best to think of a Table as a container for data. Easy to reference, manipulate, etc. Tables are how Excel is done.

877-392-3539 Excel Consulting Services
Coming soon to an Excel file near you:

Coming Soon: Using the ChatGPT Excel 365 Add-In to build Excel Tables.

Coming Soon: Using the ChatGPT Excel 365 Add-In to build Excel Tables.
Repurposing Excel Tables in Excel 365 Development
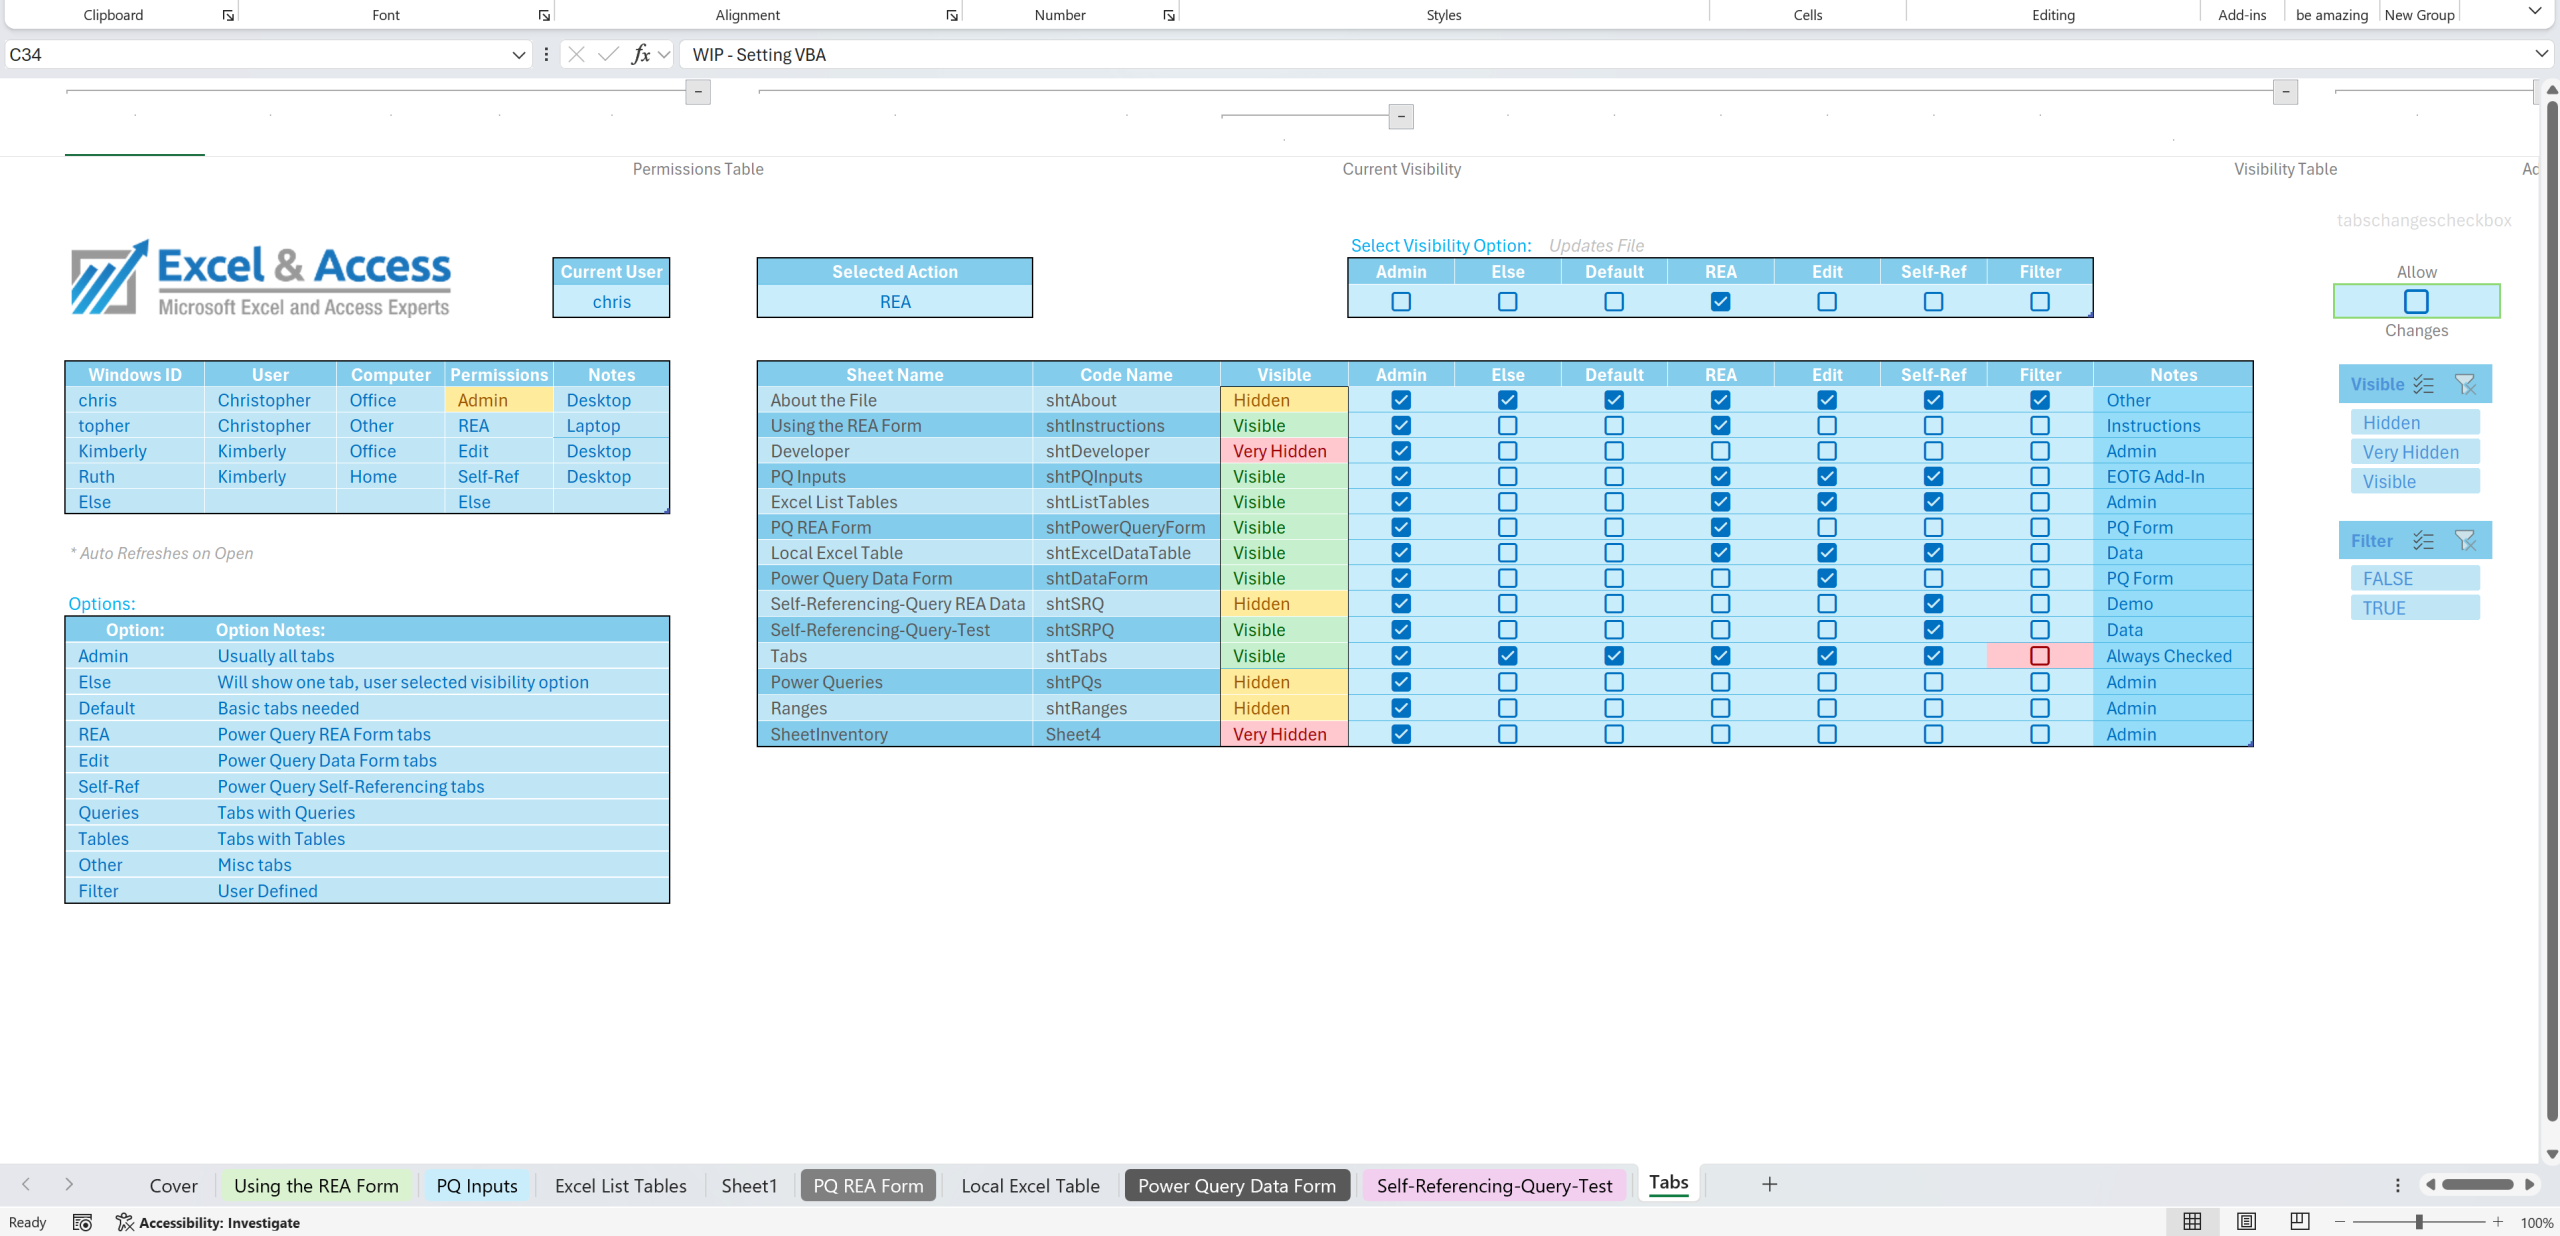
In the video below, we show how we combine 1) an Excel Table, 2) CheckBoxes, 3) Data Validation, and 4) VBA, to Show/Hide tabs in the file, based on a User Permissions.
- An example showing, Tables do a lot more than simply hold data. It is an object we can use in a variety of ways. And yes, you can even put data in them, versus a Range, ha ha.
- Great little demo, vba really makes it pop. Simply check a box, and instantly you see the tabs that you want to see. What could be more simple?
Types of Tables in Microsoft Excel 365
There are several types of Tables in Excel 365. Each works its own way. We cover them here.
- Beginner:
- Basic Excel Table
- Excel Data Table
- Excel List Table
- Basic Excel Table
- Intermediate:
- Pivot Table
- Excel Tables with Calcs, CheckBoxes, DropDowns, Data Validation, Conditional Formatting, Named Ranges, VBA, etc.
- Power Query Table
- Advanced:
- Power Pivot Table
- Hybrid Table
- Power Query Table with Excel Table attributes
- with Calcs, CheckBoxes, DropDowns, Data Validation, Conditional Formatting, Named Ranges, VBA, etc.
- Power Query Table with Excel Table attributes
- Tables as Data Entry Forms
- Both Excel Tables and Power Query Tables can be used as Data Manipulation Forms.
- VBA is usually needed.
- You can use a Self-Referencing Query to avoid VBA.
- VBA is usually needed.
- Both Excel Tables and Power Query Tables can be used as Data Manipulation Forms.
 Data goes in Excel Tables: When we start a new project for a client, we always start with the data, and that means Tables. That means that we use Power Query to bring in the data, and then we store it in local Excel Data Tables. The Pivot Tables and such then look at the Power Query based Data Tables as their source of data.
The data flows through the solution, like water.
FLUID Excel w/ Power Query Solutions for Business 877-392-3539.
Power Query and Pivot Tables look at the data in the Excel Tables, as do Dynamic Array Functions. It starts with data and that means Tables.

Modern Excel 365 solutions are based on Tables & Power Query.
Toll-Free: 877.392.3539 | Irvine, California: 949.612.3366 | Manhattan, New York: 646.205.3261
Microsoft Excel 365 Tables
Excel Tables are where you place your data. Excel Tables can be used as List Tables as well as Data Tables.
- A handful of Excel developers use Hybrid Tables/Advanced Tables ( Tables with CheckBoxes, Validation Lists, VBA, Functions, etc. ).
- Some Excel Developers use Excel Tables as interactive data input forms.
 If you use Excel, and if you have data, place it in an Excel Table, not in a data Range.

Data goes in Tables, not in ranges. Here we add a drop-down, checkbox and calculations.
Excel Tables can be Simple or Complex
In the image below, we use six Excel Tables, CheckBoxes, DropDown Data Validation Lists, Data Validation, Conditional Formatting, Slicers, and VBA. This is a complex example.
- When the workbook is opened, the Windows ID will determine which tabs are visible to the current user. All based on simple to change permissions settings.

Excel Tables used to manage user permissions and tab visibility.
Excel List Tables
Mini-Tables used by Data Validation DropDown Lists, loaded into Power Query, the Data Model, and such.

Excel List Tables are mini-Tables used to feed Drop-Down Lists.

More advanced Excel List Tables.
Video showing how to enter data into an Excel Table.
This demo shows the use of Excel Data Validation Lists as Drop-Down selections.
Creating Excel List Tables with the ChatGPT Excel 365 Add-In.
With all of the bells and whistles.
For this demo, simply populate the input sheet, then run the Instructions through the Add-In. (Blog Post pending)

Here is what ChatGPT online said after I uploaded the completed workbook.

Here are three of the Excel List Tables created by the ChatGPT Excel 365 Add-In.

Here is a quick video showing the file running.
Basic Excel Table
The basic Excel Table holds data, and that is it.
- Note: Much of the time you will not grant the user access to the data table.

Basic Excel Table. It contains data.
An example of an Excel Table holding data, but this table Refreshes.


Intermediate Excel Table
Sometimes you want the Excel Table to be interactive, such as with Excel Trackers. There the user works directly with an Excel Table, where they are able to change much if not all of the data in the Table. We build a lot of custom Excel Trackers for Business, give us a call 877-392-3539.
Below: Here you can place protected columns with calculations. You can add CheckBoxes for True/False selections. Adding Drop-Down Lists really help the user to enter the correct data, etc.
- In the right hands, an Excel Table can be an interactive, and dynamic interface. If you really push it, you can use it as a Data Entry Form.

Advanced Excel Table. Might have DropDown Lists, CheckBoxes, Calculations, Conditional Formatting, Named Cells, Data Validation, Cell Protection, all sorts of stuff.
Common Examples of Components in an Intermediate Excel Table:
- Place calculations in one or more columns of the Table.
- Example would be to use an XLOOKUP to look for a value in another Table, based on a value in this Table.
- Place CheckBoxes in a column, to be used by the user, as a Filter, connected to a Slicer.
- Example would be to Show/Hide rows.
- Add a DropDown List to allow the user to select a client.
- Apply Conditional Formatting, to highlight certain values.
- Add Slicers to quickly filter the data in the Table.
- Add a Total Row.
- Add Column Grouping.
- Example, to hide a wide column, such as Notes.
- Add a Status column, based on a Drop-Down List.
- Add Cell Protection to one or more columns.
- Upload the Excel Table into Power Query, where you can Transform the data.
** There are many more components that can be added to Excel Tables and Power Query Tables in Excel 365.
- Table Components
1. Calculations
2. Slicers
3. Data Validation
4. Data Validation Lists
5. CheckBox
6. Conditional Formatting
7. Named Cells/Ranges
8. Protection
9. Totals Row
10. Header Row
11. Data Range ( Body )
12. Grouping
13. Sorting
14. Filters
15. VBA/Macros ( Event Code )
Excel Tables are not used enough. If you are not using them, it is time to consider changing that.
We can help, 877-392-3539.
Excel Tables as Data Entry Forms
You can even use Excel Tables as Data Entry Forms. That is correct, you can push Excel Tables to the extreme, by adding powerful components, allowing the user to use them to add data to an Excel Table, without giving them direct access to the data Table.

Two Excel Tables used as a Data Entry Forms. The top Table is for client data, the bottom table is for the order details. Two Tables, like in an Access database, rather than one Table with duplicated content.

Both Excel Tables and Power Query Tables make great data entry forms.

As you can see, there is a lot more you can do with Excel Tables than just house data. You can make them interactive, great for custom Excel Trackers. You can use them as data entry forms as well. What you can do with Excel Tables depends on your skills and imagination. There really is no limit.
Toll-Free: 877.392.3539 | Irvine, California: 949.612.3366 | Manhattan, New York: 646.205.3261
Pushing Excel Tables to Their Limits – More than House Data
- Excel Tables make GREAT Data Entry Forms.
Perfect use of Interactive Excel Tables – Excel Trackers
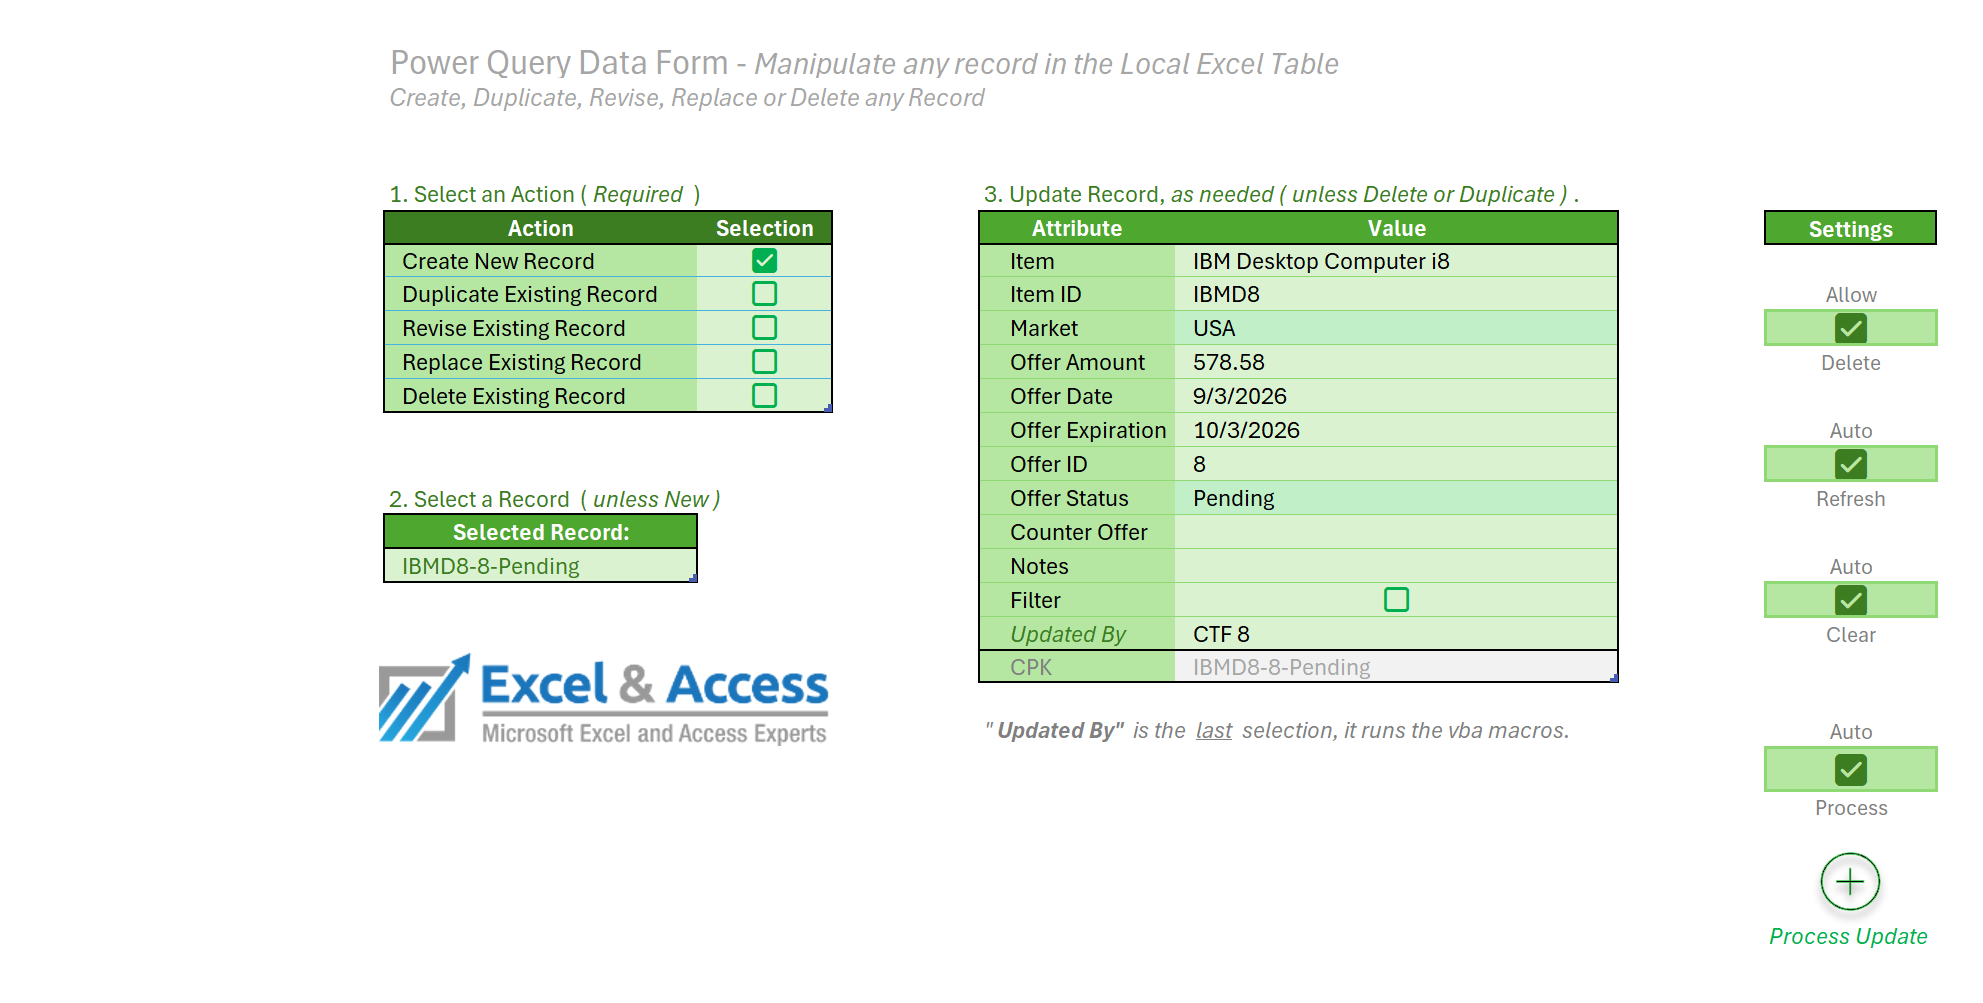
Below is a powerful set of Tables, used as Forms, for data entry.
- Add a new record.
- Duplicate an existing record.
- Replace an existing record.
- Revise an existing record.
- Delete an existing record.
Power Query Table used as Data Manipulation Form.

Our most advanced use of Tables. Here a Power Query Table is used to edit existing records.
Excel List Tables Explained
Excel List Tables are basically Excel Tables, just smaller, often just a column or two. They are usually used as the basis for Excel’s Data Validation drop-down lists.

Users in Excel love to use Drop-Down lists to make a selection. Here we show many of the different options available.
Video: Dynamic Excel List Tables.
The purpose behind the use of these DropDown Lists, controlling the user combined with ease of use. The user can add an item to the List Table; it is instantly available in the Drop-Down List. That is half the point right there.
How are Excel List Tables Used:
- Referenced in other Excel Tables for data entry.
- To control what data is entered.
- Versus typing anything they want.
- Typing anything they want is actually an option.
- Versus typing anything they want.
- To control what data is entered.
- To simplify the addition, subtraction, or changes to items in the List, by the user.
- Versus using Range data, which is harder for the average user to update.
- For Lists, Defaults, Filters, Joins, in Power Query and the Data Model.
Excel Developer Notes:
- Depending on the settings, the user is either restricted to select an item from the list, or the user can add an item on the fly.
- These Lists can also be based on the data in the actual data Tables, instead of the List Table.
- These Lists automatically pull Unique values only.
- You can start to type the selection you are looking for, and if it is in the list, you can then hit return to select it. Example, type Ca to see California.
- Excel Lists can also be based on a Spill Cell, instead of an Excel List Table. =spillcellname#

Excel List Tables make data selections easier, safer. Users love them.
List Table Options:
- Default Option
- User Filter Option
- Sort Order Option
- Add Item not in list Option
- DAF generated Method, leveraging the #
- Use Change Event Code Automation Option.
* All List Tables are loaded into PQ & the Excel Data Model. Here they are used as Filters and in Joins.
** There are many ways to program Excel List Tables, below, I go over a few of the more common techniques.
Any item in the List Table is available in the associated Drop-Down List. These are also available to Power Query, Dynamic Array Functions, Conditional Formatting, the Data Model, and more.
Excel Expert’s Advice: When you used List Tables to populate a dropdown list, make sure to name the column of the Table to be referenced, so that when you move it to a different sheet in the file, it still works.
- Use Named Ranges in the Excel List Table. Name the column, such as “regions”. ( See image below )
Do NOT do it this way! Name the column and reference that instead.

This is not the way to use Drop-Down lists in Excel. Name the Column, do not use it this way. When you move the DropDown Selector to a different tab, this method will stop working.
Do it this way!

Name the column, of the Table, to be used in the List.
Do it this way! Here, pick from the list or type anything you want.

This setting will allow the user to overwrite any value in the list. Proceed with caution.
Taking List Tables to the Next Level
Video: Excel List Table Default loaded into Power Query.

Load Excel List Tables into Power Query. So much power.
This is how Excel is Increasingly Done.
Toll-Free: 877.392.3539 | Irvine, California: 949.612.3366 | Manhattan, New York: 646.205.3261
Power Query Tables
Important Note: Power Query Tables while similar to Excel Tables, are not the same thing. Power Query Tables reference data; Excel Tables house data.
You refresh the data into a Power Query Table; you add data to an Excel Table.
Power Query Tables read data contained in Excel Tables, or Queries.
Expert’s Note: That said, many of the components used with Excel Tables can also be used with Power Query Tables. Just remember, PQ Tables Refresh, and that changes how certain things work.

Basic Power Query Table with Filters and a Slicer.

Advanced Power Query Table. Has CheckBox, DropDown, Calcs, and a Slicer.
Power Query Tables as Data Entry Forms
Power Query Tables are incredibly powerful. If you push them, bend them, you can make them even more powerful, and you can use them as Data Entry Forms in Excel 365.

Power Query Table used as Data Entry Form.

A Power Query Table used as a Form.
Power Query can Pivot and Unpivot Data – Pivot Table Alternative
Here we use Power Query to create a Pivot Report. Power Query can Pivot, Unpivot, GroupBy and Transpose, great for generating reports.
You can make this interactive using DropDown Filters, CheckBoxes and Slicers.
Power Query Pivot Report: You can Pivot and Unpivot in Power Query.
Video: Showing how a Power Query Table can Pivot data. A Pivot Table alternative.
Images of Power Query below:

Power Query TRANSFORMS your data. Pivot, Unpivot, Transpose, GroupBy, etc.

Here we Pivot the column.
Power Query Custom Data Type Card; aka Card
Few use this, fewer have ever seen it. It has its use, it is powerful, it replaces the need for the CHOOSECOLS Function in this demo.

Few have seen these, Custom Data Types in Power Query. Created a very cool Table. You select which columns to add to the sheet, and in which order. You can click on the image and a pop-up is displayed, showing the details for that record. These are also called “Cards”.
While you may never have the need to do this, it is extremely useful. Works much like using CHOOSECOLS, the user selects which columns, in which order, they would like for the data to appear. Very cool.
- Also a great lookup, summary tool, where you can click on the record, and see the Card popup with all of the details.
Video: Power Query Custom Data Type, aka ‘Card’.
Power Query Tables as Reports
Power Query Tables loaded to Sheet can be used as interactive reports. No need to load a Table, point a LAMBDA at it, to create a report, you can do all of that directly in Power Query.
- We do this all the time, in most of the files we work in. We do as much as possible in Power Query, and we have found that many of the reports people create with a series of onsheet functions can be more easily done directly in PQ. Controversial I know.
Power Query Tables take Excel 365 to the Next Level, in the right hands. Just remember that they Refresh, and they are not the same thing as an Excel Table.
Toll-Free: 877.392.3539 | Irvine, California: 949.612.3366 | Manhattan, New York: 646.205.3261
Hybrid Tables
~ The Best of Excel Tables & Power Tables Combined ~
A Hybrid Table is a Power Query Table, with additional columns inserted onsheet. These additional columns function like an Excel Table, as these columns are onsheet, not in the Query. I call these “non-query columns“.
Power Query Tables refresh, Excel Tables do not. Be aware of how Refresh works, and what Refreshes.
- Note, where you insert the columns, what those new columns do, that determines what you can and cannot do. So it does not work in all circumstances.

Hybrid Table in Excel 365.
Where you Place the New Columns Possibly Matters
What you place in the non-query columns definitely matters
Where you insert the columns, and what you place in the columns matters, and it depends on how the query works, what it returns. Are the rows constant, that makes the difference.
The LinkedIn Survey:
Most people do not insert columns into a Power Query Table as they do not know it is possible.
The majority of programmers that do insert columns into the PQ Table do so off to the far right.
Surprisingly, 24% of the respondents said anywhere they want. That is what we do.
Warning: If you place manually typed data into one of the inserted columns ( non-query columns ), if on Refresh, the rows are sorted, or if you insert a row into the Table, the typed data will not move with the rest of the row, as there is no association, as there is with an Excel function. For this method to work, manually typed data into a non-query column, the order of the rows in the Hybrid Table must not change.
https://www.linkedin.com/in/excelandaccess/

LinkedIn Survey
Why would you want to use a Hybrid Table in Excel?
- If the calculation you need is too complicated to write in Power Query, you can write it onsheet, after you insert a new column, into the Power Query Table. Now you can place any non-Spilling function into the Table.
- If you do not know how to do Joins in Power Query, you can instead insert columns onsheet, in the PQ Table, non-query column, and use the XLOOKUP between Tables.
- If you want to add columns that are not in the Power Query Table.
- As a Data Manipulation Form.
We use Hybrid Tables in most of our custom solutions for business, as they are one of the most powerful, user-friendly approaches we know of.
MS Excel 365 Pivot Tables
~ Pivot Tables are the Base Component of Excel Dashboards ~
Excel Pivot Tables, DAFs, VBA, Tables, that is how Excel 365 is done. Pivot Tables are easy to program, easy to use, and they are EXPECTED.

Excel and Access, LLC Corp: Need help with your Pivot Tables or Pivot Charts? Contact us for help.
Pivot Tables are one of the most expected components of an Excel Dashboard. C-Level execs expect to see them; they expect to use them. They are extremely useful.
So many ways to Pivot your data in Excel.
Pivoting data is so useful, the Microsoft Excel Team created a new Dynamic Array Function for this, the PIVOTBY Function.
You can also Pivot or Unpivot, directly in Power Query.
For BIG Data needs there is Power Pivot.
Pivot Tables are Dynamic and Interactive.
They allow you to make sense of your data. You can see the summary level; you can drilldown into the details.
Slicers make them ultra easy to work with.
The best Pivot Tables are often based directly on Power Query and not on a Table on a worksheet.
How you use them is what makes the difference. They can be incredibly simple, or ultra-advanced. ( I once saw a client create three separate Pivot Tables, one for the Amount, one for the Count, and one for the % Of. ) Knowing how to use them makes all the difference.
Pivot Tables are one of the most expected components of an Excel Dashboard.
Note: Auto-Refreshing Pivot Tables are new in Excel 365. This saves the user a step, and that is huge.

Pivot Tables are not dead; they are incredibly useful. ( Basic Example )
Pivot Tables allow you to see how your business is performing. You can see the amount, the change, the percent of, etc., all in one interactive, dynamic Table. You can then instantly drill-down into the details. Leveraging Slicers makes it more interactive.
Pivot Tables are incredibly powerful. If you do not use them, you may want to reconsider that. Each tool has its place, its use.

Excel Pivot Tables are the easiest way to make sense of data.
Adding Conditional Formatting to Excel Pivot Tables draw your eye to what you need to see.

Executives expect to see Pivot Tables in their Excel Dashboards; they drill-down into the details.
Power Query Based Pivot Tables in Excel 365
Instead of loading a Power Query Table to a worksheet, and then basing a Pivot Table off of that, base the Pivot Table straight out of Power Query. Create a Query for the Pivot Table. Save resources, save a step.

Base your Excel Pivot Tables on a Power Query query.
Then there is the new Excel PIVOTBY Function. Same results as the Pivot Table, but in a Dynamic Array Function. No need to refresh, but soon, there will be no need to refresh a Pivot Table. So many Pivot options in Excel 365.
What is amazing about the PIVOTBY and the GROUPBY Functions is that everything in the image below, is in one function ( Headers, totals, sorting, filtering, etc. ).

Excel PIVOTBY Function.
Pivot Tables are the backbone of modern Excel Dashboards. C-Level Executives expect to see them.

Excel Dashboards are often based on Pivot Tables.
Power Pivot Table & BIG Data
Not for the faint at heart, not for the non-committed. Power Pivot and the Data Model are, well, not easy. That said, the Excel Data Model and Power Pivot are amazing. This is how BIG Data is done in Excel 365.
Power Pivot is like Pivot Tables on mega steroids. A whole new ballpark.
Why Power Pivot: Tens of millions of records. Pivot Tables based on multiple Tables. A more efficient calculation engine. Based on Power Query.
It takes a lot to be good with Power Pivot.

The Excel Data Model and Power Pivot Tables.
Same Simple Demo as the Basic Pivot Table, but this is Power Pivot, Excel Data Model. Harder to do than the basic Pivot Table, but it does so so much more.
Power Pivot and the Data Model eliminate the row limit in Excel 365. As such, they have a use, BIG Data needs Power Pivot.

The Excel Data Model works much like Microsoft Access.
Power Query feeds the Data Model and Power Pivot.

Queries read Queries. Data flows from the top down.

Tables in Excel 365 make your work a breeze. From List Tables to Power Pivot Tables, and everything in between, Tables are how Excel is done.
Power Pivot and the Excel Data Model are Advanced
Not easy to learn, not easy to use, well worth the effort. I love the Data Model and what it can do.
If you have millions of rows, or if you want to pivot on multiple Tables at the same time, Power Pivot and Excel’s Data Model are the solution.
PIVOTBY Function
The PIVOTBY Function in Excel 365 is one of two new functions, that are basically a report in one cell, one function. I call them the “BY” Functions. They are a significant change to how formulas work in Excel 365.
The results are the same as the Pivot Table, but there is no need to Refresh or for auto-refresh.

PIVOTBY Function in Excel 365.

Point the pivotby, groupby, choosecols, filter, lambda, at an Excel Table.
Tables Beginner to Advanced – Conclusion
There are four types of Tables in Excel 365. Each works somewhat differently. Each has its use. Some are easier than others to learn. But knowing Tables is no longer an option in Excel programming, it is required.
If you do not work with Tables in Excel, perhaps now is the time to learn. Once you do, you will say the same thing that everyone else says after they learn Tables, “I will never program Excel the same again; game changer.”
Toll-Free: 877.392.3539 | Irvine, California: 949.612.3366 | Manhattan, New York: 646.205.3261
Contact us for a Free Consultation Today.


It’s crazy how many different ways you can incorporate Tables into your workbook. Tables are Excel’s most powerful tool, because they are a solid foundation on which to build spreadsheets.
Akin to what you show in one of your sections, I’ve used Tables as data entry forms that connect back to a master Table (which is kept hidden away from users). Master Tables always have multiple columns with each row being a unique record: a great way to store data, but not user-friendly for input. So, we:
1) Extract the record the user wants to edit.
2) Transpose it (as a Table) to make data entry more intuitive.
3) Provide data validation in the input table to keep the data clean.
4) Re-transpose it back to a horizontal orientation to update the master Table.
And all of that is done behind the scenes with Power Query (and a dash of VBA). Easy. Secure. User-friendly. That’s the power of Tables in Excel.
P.S. I love the interface you show using a Table to show what each user may or may not do in Excel. That’s a highly inventive use of Tables. Points to you!
I agree. I have seen your work on that, it was impressive. I love your combined use of PQ, VBA and LAMBDA. Very clean, streamlined solutions. You are pushing the New Excel to the next level, with emphasis on LAMBDA.
Excellent (and detailed!) overview of tables – probably the best I’ve read.
I have been building Excel solutions in financial services for over 20 years – Excel Tables completely changed the way I design & develop Excel solutions which are now “Table-centric”.
Tables, especially when paired with Power Query, helps avoid writing reams of VBA code and makes retrieving data more robust and seamless.
Thank you sir. Coming from you that means a lot. It is a long post, written for my clients and leads, to give them an idea of how Excel is done.
I love your custom solutions and what you do with Excel.
Great overview of a topic that doesn’t get nearly enough attention. Tables really are the foundation of everything, once you start building solutions the right way, with data flowing from Power Query into Excel Tables and out to Pivot Tables and DAFs, you can’t imagine going back to raw ranges. The section on Hybrid Tables is particularly useful; most developers don’t even know that’s possible. Well done.
Thank you sir. I appreciate the feedback.
Hey, these are all things that you do Jeff!