


Excel GroupBy Function for Interactive Reporting
Interactive, Dynamic, and Automated, the new Excel GroupBy Function is going to be front and center in Excel reporting and analysis for years to come. A nice addition to custom Excel Dashboards. With so many user-selected options, this function is designed to be interactive.

877-392-3539
Our Excel Experts Say: Straight out of the gate, I found this function to be useful. Not any harder to use than any other Excel Function, but it has 8 Parameters, and all but three are optional. If you work in finance, marketing, or accounting, you will want to learn and to use this function as a primary reporting tool. The options are endless; you can use any function desired, including LAMBDA. The Excel Team is not messing around; this is a serious function.
The Future in Excel Reporting is Here: I predict that the GroupBy Function will be one of two top functions in Excel, with PivotBy being the other. Give it a year or two, and these will be used more than any other reporting tool in Excel. Interactive, sweet.
Please Store Your Data in an Excel Tables: Effectively use Excel Tables and not data ranges, to store your Excel data. Power Query will reference this table. You can add additional filters, using Power Query variables.
Always Make Your Excel Solutions Dynamic and Interactive (Optimize Interactive Reporting in Excel):
Use DropDown Validation Controls, Macros, and the new CheckBox feature. These will allow the user to determine what the report will include, what it will contain, and how it will look. The new Microsoft Excel GroupBy Function will change how Excel reporting and analysis are done. Gone are the days of thousands of cells with formulas.
Leverage Automation and Integration for ease of use: To further automate your custom Excel solution, use Power Query as the datasource for your GroupBy Function. Power Query can have additional filters available. Add the use of VBA as needed. This is how Excel is done.
 Our Excel Expert’s Advice: Learn to use the GroupBy Function in Excel 365. It is a game-changer. Great for custom business reporting and analysis. A great component for custom Excel dashboards.
In the image below, you see a Power Query Table, the GroupBy Function, along with Drop-Down Filters and CheckBoxes. The user can select any combination of up to four Filters.

Power Query and Tables, should be the backbone of any good Excel solution.
 Interesting Note on the Sort Order Option in GroupBy:
When you chose the column to sort by, you at the same time have selected the sort order, all in one, versus two for the Sort Function.
In the image below, note the negative numbers in the Sort Order DropDOwn List. This allows you to manipulate the Sort Options with one cell, not two. So smart.
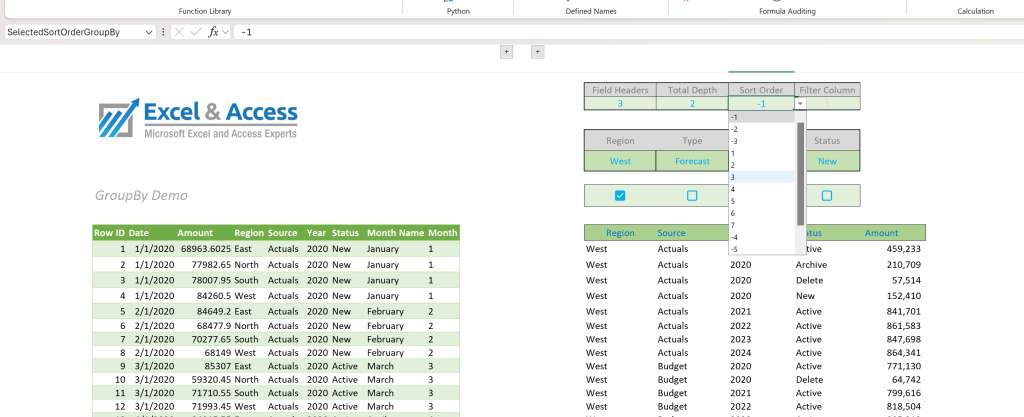
Note the Sort Order option in the GroupBy Function, it is in one cell, not two, due to the use of negative values.
Do you need help with your Excel workbooks and the GroupBy Function?
We can help you with the GroupBy Function for Interactive Reporting
As professional Excel Consultants, we program in Excel for business, we also offer Excel training services. Work with the top Excel MVPs, work with a Microsoft Certified Partner, work with Excel and Access, LLC.
If you need help with your reporting and analysis workbooks, please give us a call, we are here to help. 877-392-3539

Excel 365 Reporting & Analysis Dashboards are Interactive
What Excel Users Like: CEO, CFO, COO, Sr VP, etc., what they all have in common is that they want a fully integrated and automated Excel Dashboard Solution that is highly interactive. They want a point-n-click interface. They want to make choices from drop-down lists, CheckBoxes, and Slicers.
The GroupBy and PivotBy Functions in Excel 365 are the new tools to know. Either are easily the most powerful functions in Microsoft Excel. The GroupBy function is so easy to use, it is covered in this post.
For a Complete Solution: Use Power Query, use DropDown Filters, add Checkboxes, and Macros to allow the user to setup the report, on the fly, with ease of use. This is the new Excel, and this is how Excel will now be done. Excel programming is becoming easier to do as the months pass.
Always use Tables/Always use Power Query: Make programming Excel about as easy as it can get, always place your data in Tables.
Users Love Pivot Tables: Use Pivot Tables and Pivot Charts, with Slicers, in your Dashboards.
Use DropDown Lists: In the image below, the user can select the Year and the Segment, for the Waterfall Report. Users like the reports to be interactive.
Use CheckBox Controls: Simple to use, allows the user to select Yes/No, On/Off, Black/White, etc. A great way to make your Excel solution interactive.
Use Slicers on Tables: Make it easy for your client to filter the data in the Table.
When it Comes to Which Functions to Use: Always try to use the latest and most powerful dynamic array functions available in Excel 365.
GroupBy Function for Interactive Reporting simplifies Excel Reporting

Dynamic Array Functions simply Excel reporting, they allows the user to interact with the data.
GroupBy Function Based Reporting: The New Standard in Excel Programming
Just as people compare the XLOOKUP to the VLOOKUP, people will compare the GroupBy Function to the CHOOSECOLS, TAKE, and FILTER functions. And the analogy is correct.
In the example below, we use the new Excel 365 GroupBy Function. We wanted to see what we could do with it, in terms of allowing the user t make changes to the report, based on the selection of CheckBox and Filter buttons. This example allows you to test each of the GroupBy Function arguments, easily, great for learning.

Here the user can use the new CheckBox Control and the DropDown Validation Controls, to manipulate the report.
One Cell, One GroupBy Function, an Entire Report
This is Range-Based Programming
One Cell, One Function, One Report. Financial reporting and analysis will never be the same; the time it takes from concept to report is cut by 75% or more. This is how financial reporting is now done.
Have your data in Tables, use Power Query, use lots of Filters, use GroupBy and PivotBy, use Pivots, and add VBA and you have a powerful, interactive, and easy to use custom Excel solution.
In the past, an interactive report could take days to build
Interactive Reporting in Excel – This is cell-based programming
In Excel 365, the solution is dynamic. One cell, one function, an entire report is range based programming. You can build a custom report in minutes. Take an additional 10 minutes, and you can make the GroupBy Report fully interactive for the user. Add Dropdowns, CheckBoxes, Macros, whatever you need to simplify the experience for the user.
- Why write an Excel function for each and every column in your report?
- Why would you take the time to copy down the formulas, to account for new data?
- Write one function in one cell, and let the results Spill.
- This is increasing how Excel is done.
So many options you can use in the new GroupBy Function:
- Choose Sort Column
- Apply one or more Filters
- Choose Headers
- Choose Totals and Subtotals
- Above or below
- Base it on a Power Query Table. as shown below.
- Leverage Power Query’s ability to dynamically and interactively filter.
Comparing the Excel 365 GroupBy Function to GroupBy in Power Query
~ All of our custom Excel solutions start with Tables and Power Query ~
Interesting, the GroupBy feature has been available in Power Query since 2010. Excel is just now got it, no complaints, a huge and instant impact on Excel programming. This will cause a huge shift in how custom Excel programming is done. So now we all need to learn how to use it, best practices, etc.
But before we do, quickly consider that Power Query is stronger than Excel, it is easier to use, and it is a time saver. Power Query allows one to Group, just as does an Access database.
With all of that said, if you have the option to use the GroupBy Function against a large Excel Table, or to use the GroupBy in Power Query, do the later. Why populate the sheet via a calculation when you can get a hard-coded Table out of Power Query. The more you can do offsheet in Power Query, and the less you can do onsheet with Excel functions, the better.
When you do need to use onsheet functions in Excel, be sure to point them at a Power Query Table, for added power. You can have additional user selected variables for Power Query, changing the records in the Table before the GroupBy Function does its thing. Prefiltering basically, but dynamically.
What an Excel Expert on LinkedIn Said: Since learning the basics of merging queries in Power Query more than a year ago, I was like “{V|H|X}LOOKUP() formulae, be gone!” 😍 I make very effort to avoid those formulas when setting up an Excel worksheet, as now there is no need for them in most cases. HSTACK() and VSTACK() are super useful but I resort to them only when nested inside some enclosing expression. Otherwise, I let Power Query do all the heavy lifting.
The fewer formulas in your workbook, the more performant it will be. If there are a lot of formulas, all of them will be reevaluated each time a cell is changed. Since most of the values on a given worksheet are relatively static, it seems inefficient to force all of those LOOKUP() formulas to recalculate. With Power Query, you can make changes to all the cells you want and only then do a Refresh All command to bring the Power Query queries up to date. – Says Adiv
Two Images below: 1) Excel GroupBy Function, 2) Power Query GroupBy.
Look at the two images below, and tell me, which looks easier? The GroupBy Function is onsheet Excel programming. The Power Query GroupBy Function is offsheet Excel programming. Power Query is offsheet programing, and it is preferred to onsheet Excel Functions.
1) Excel GroupBy Function for Interactive Reporting

2) Excel GroupBy Function In Power Query for Interactive Reporting: Image
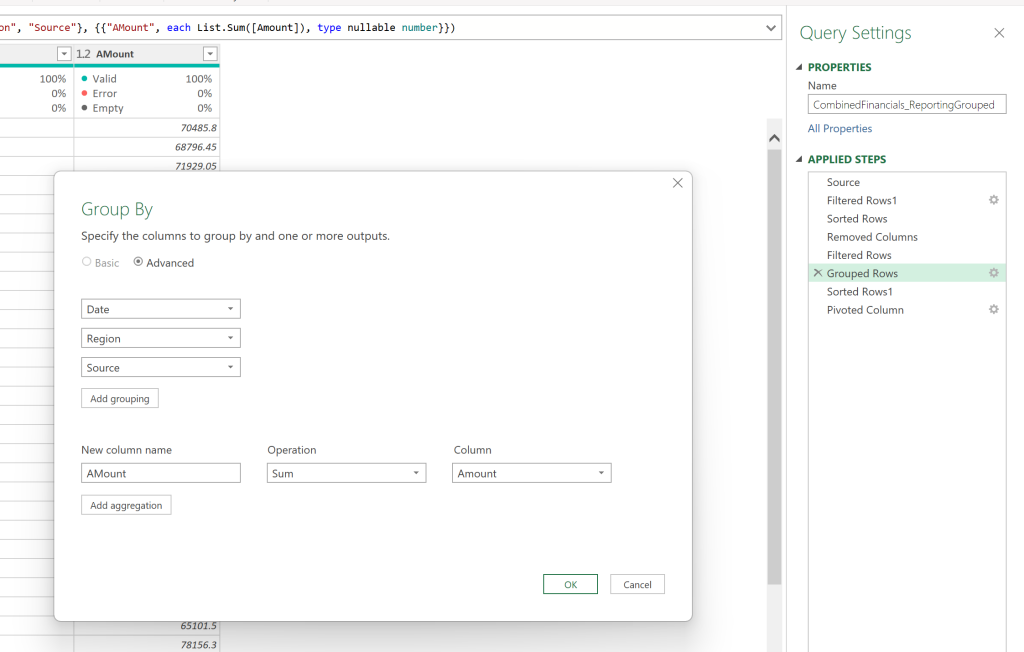
Power Query GroupBy is more powerful than the Excel GroupBy Function.
Our Advice: Learn both methods of using GroupBy, in Excel and in Power Query. Then, based on the need, you can determine which method best fits your needs. But with that said, we recommend that you do as much work as possible in Power Query. Our top Excel consultants use Power Query in every solution.
Excel 365 Functions are Available in the GroupBy Function
You can use any of the 500+ Microsoft Excel Functions in the GroupBy Function, including LAMBDA. So it is safe to say that this reporting function is highly flexible.
So simple, so amazing. In the simple example below, you have three value columns. All three are based on the “Value” column. Each of the three columns performs a calculation on the Value column.
In our simple example we used: HSTACK( SUM, AVERAGE, PERCENTOF )
In the Image below: The HSTACK Has three Value Columns, the DataSource has one Value Column. Think of your options here. What limitations are there?

Use Excel Tables to store your raw data. Use Power Query to scrub and transform the data, then load as a Power Query Table to the worksheet. Your reports and analysis will be based on the Power Query output Table..
Which Functions you use with the GroupBy Function depends on your needs.
It will be interesting to see what the Excel experts do with the GroupBy Function’s calculation attribute. They say there are no limits, so what will they do with it? I personally am looking to finding that out. This one will take some time to see just how far we can push it.
In the example below we have one column in the table that has numerical values. We Have three columns in the GroupBy output, based on that column. You can have column after column after column. What do you want to see?
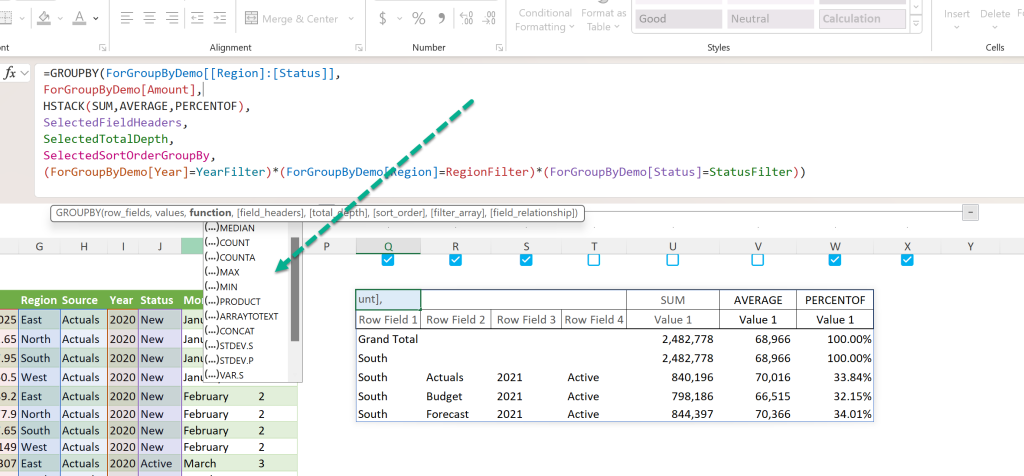
In the GroupBy Function you can use any Excel Function, including LAMBDA. See the list?
Microsoft Excel GroupBy Function Example: Using: Sum, Count, Average, etc
Below is a super simple example on how business uses the new Excel GroupBy Function. Notice the use of the HStack Function.
=GROUPBY(ForGroupByDemo[[#All],[Region]:[Status]],
ForGroupByDemo[[#All],[Amount]],HSTACK(SUM, COUNT, AVERAGE, MIN, MAX, PERCENTOF),
SelectedFieldHeaders,
SelectedTotalDepth,
SelectedSortOrderGroupBy,
ForGroupByDemo[[#All],[Year]]=YearFilter)
So many options with this function, will be interesting to see how far people push it.
Conclusion – Excel GroupBy Function for Interactive Reporting
In the past the Excel developer would create one function per column, taking the formulas down to the last row. If the data range grew, often the formula would not consider the missed rows. That was a pain; that is a thing of the past. Enter the Microsoft Excel 365 GroupBy Function. With it you can accomplish amazing things.
If you need help with the GroupBy Function, or anything in Excel, please give us a call, as Excel Consultants we offer programming, mentoring, and training services for business, government, education, and individuals. Give us a call today.
877-392-3539










Leave a Reply