


Quick Power Query Solutions
Power Query sounds complicated, but in actuality, Power Query is quite easy to learn, and pretty easy to use.
Sure, it can get complex if you press it, if you add M-Code and such, but to start, it is relatively easy to learn. You can get a great start by watching LinkedIn Learning videos ( Oz, Jon, Jeff, Mark, Wyn, etc.).
Typically, when an experienced Excel developer programs a custom Power Query solution in an Excel 365, it greatly decreases the amount of effort required to build the solution. We have saved as much as 2/3 the time needed to produce 100% custom solutions, fully automated and integrated. Power Query made the difference.
Power Query is ‘Rapid Development‘.
If you have a small need: say you need to do some ad hoc analysis, or to create a quick Dashboard, or even to consolidate data across multi tabs and multiple files, Power Query can often make quick work of it.
- Of course, this is if your data is in proper Excel Tables, always use Excel Tables.
Here we go over a few quick, real-world projects from this past week
Simple Power Query Solutions Take an Hour or More
If we use Excel functions instead of Power Query, the same results could take 2-3 times as long to produce.
Using Power Query, you dramatically cut development time. Ad Hoc analysis can be done in an hour or less.
- Add the use of the dynamic array functions for reporting and analysis, creating a quick, dynamic Excel solution based on Power Query does not take long.
Example 1 – Compare two massive CSV files
This was a quick one, easy in Power Query, not so fun other ways.
For this need Power Query was the perfect tool. Two extremely large, external data files. We created a complex primary key, to isolate new records.
- PQ did it in fewer steps than say the XLOOKUP.
Source Files: Two 167 MB csv files.
In Excel: 869,000 records per file, two files
Goal: List new records, one time effort.
Result: 1/4 MB Excel file.
Effort: 15-minutes.
I cannot show the client files, so I created a super simple demo to show the concept.
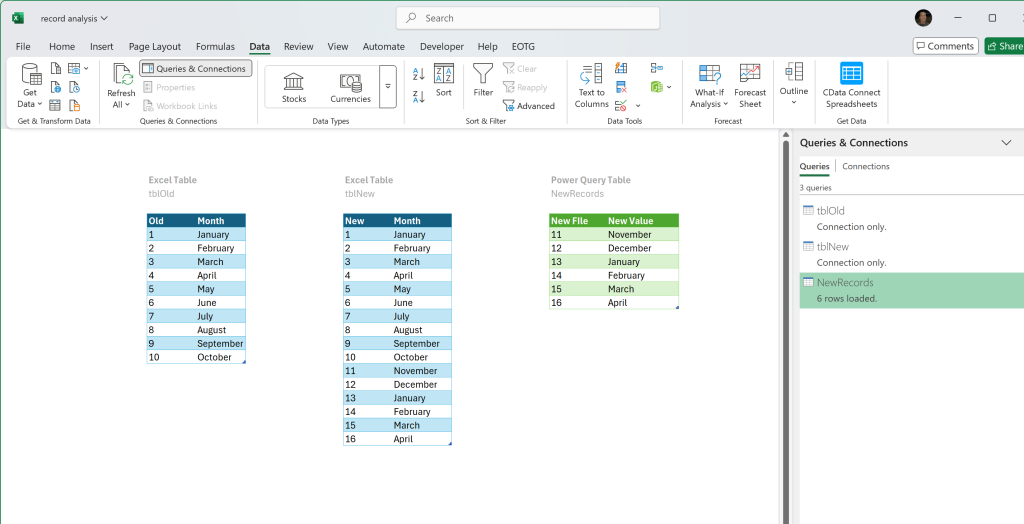
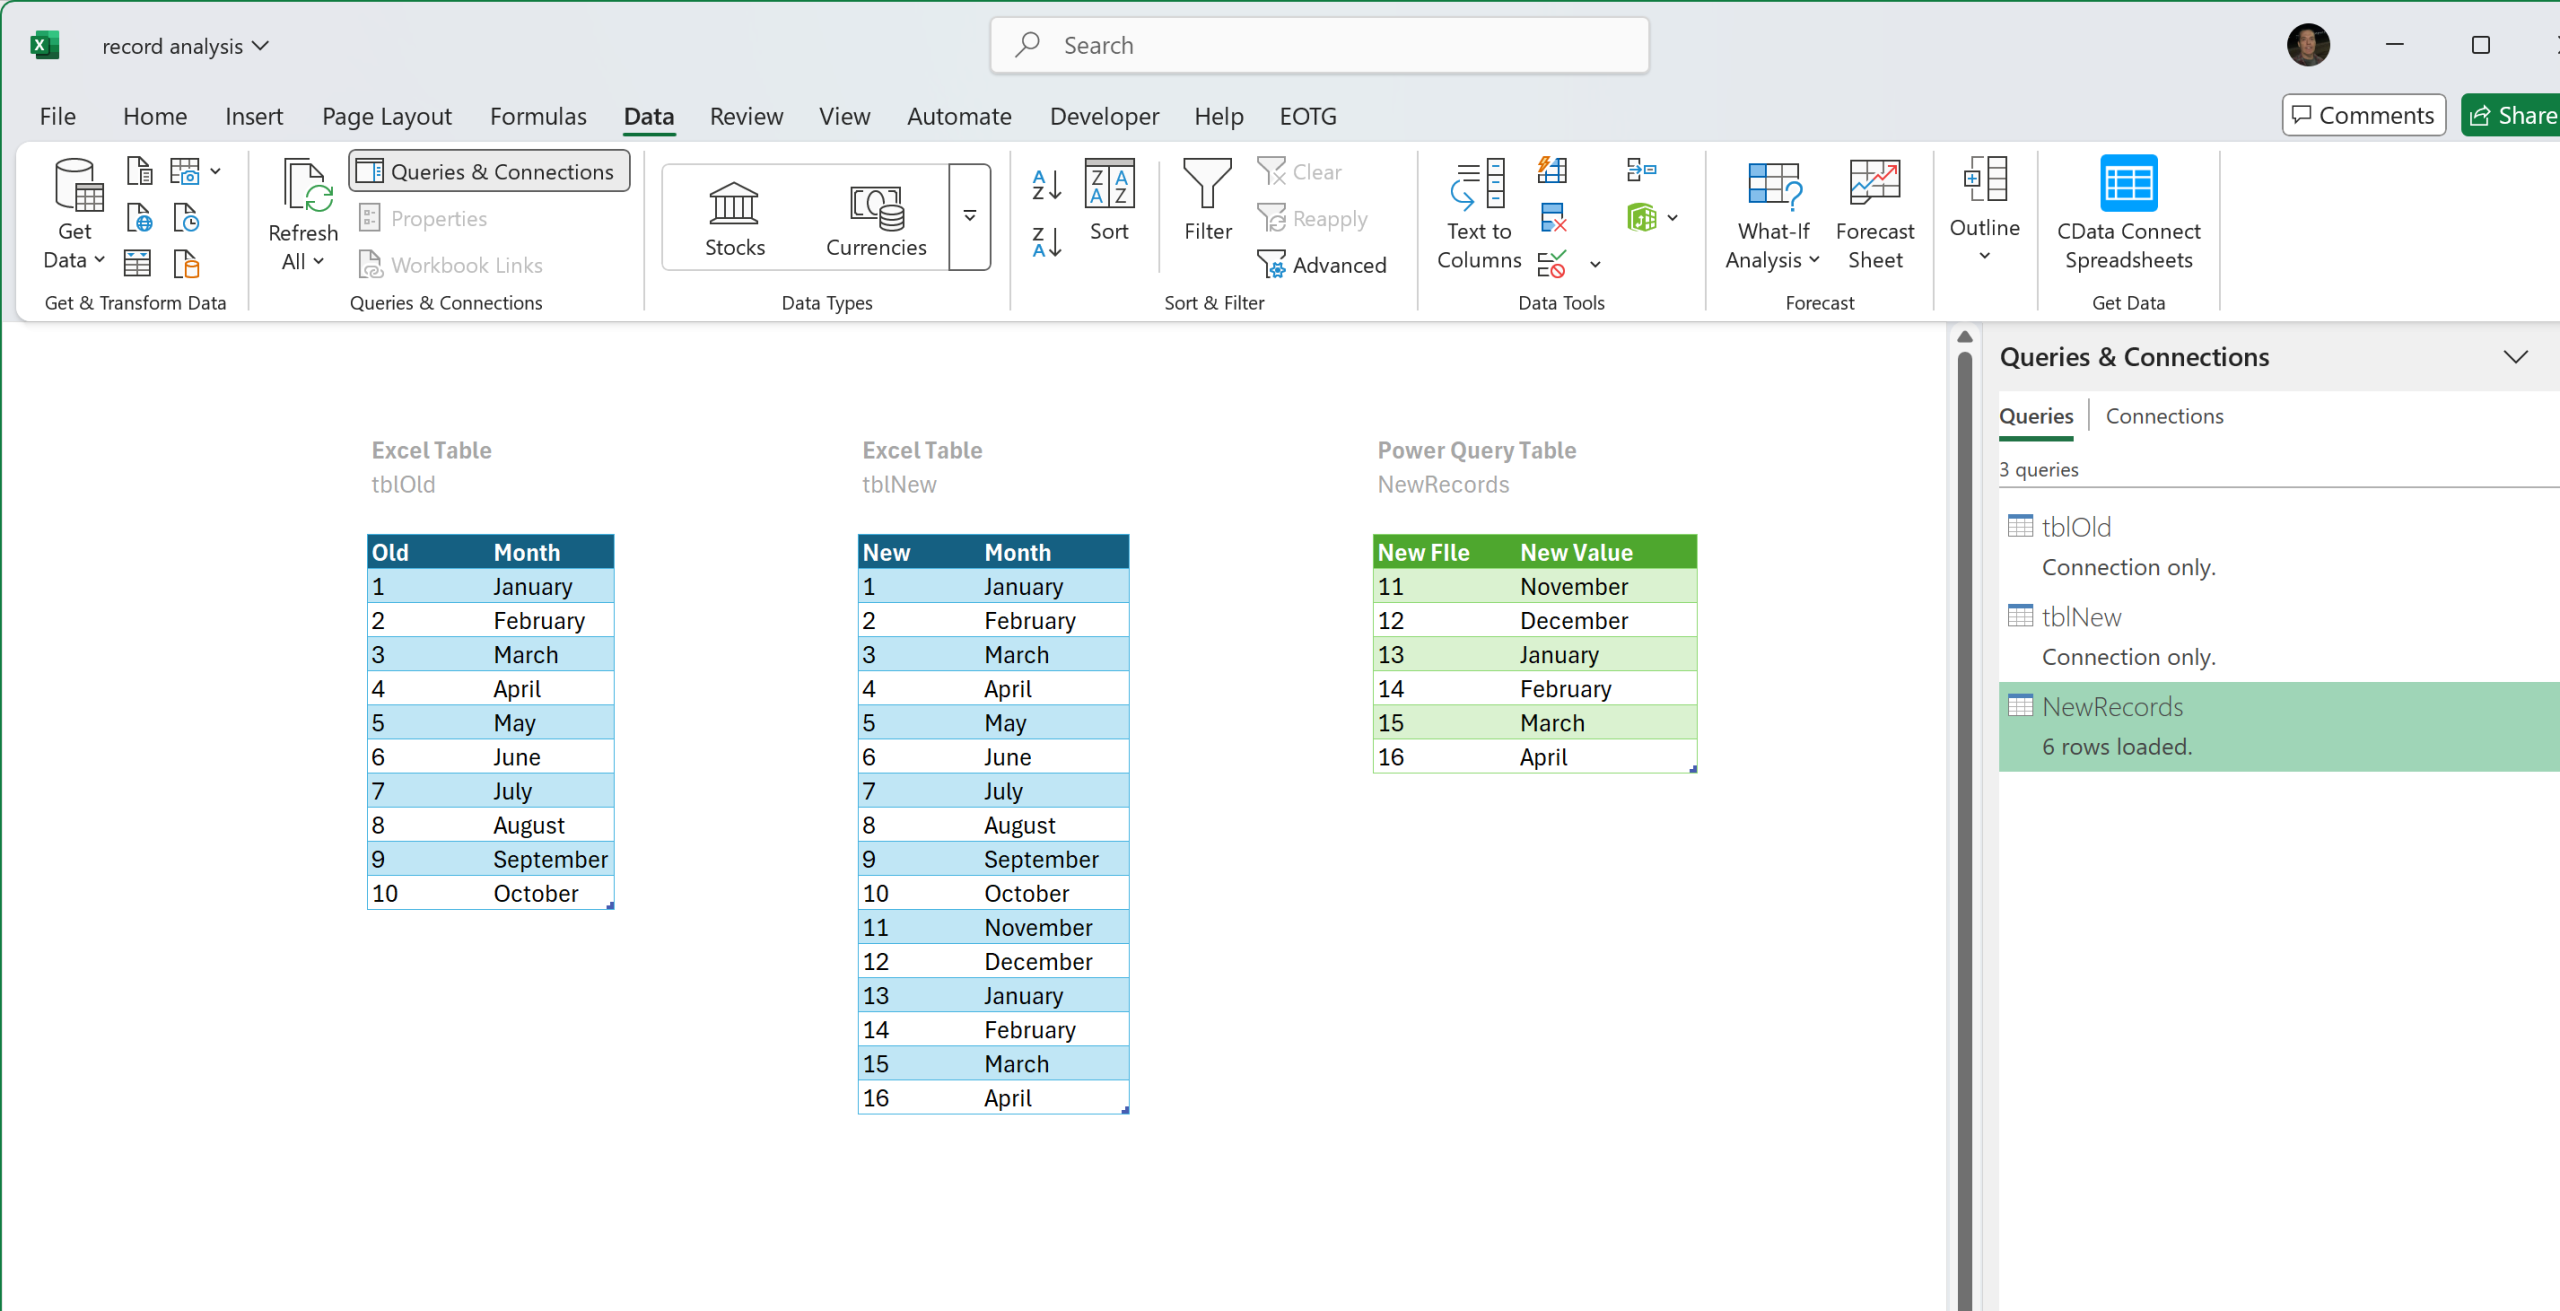
Simple Demo on how to use Power Query to find new records.
Power Query may look intimidating, but it is very easy to learn, at least in the beginning.
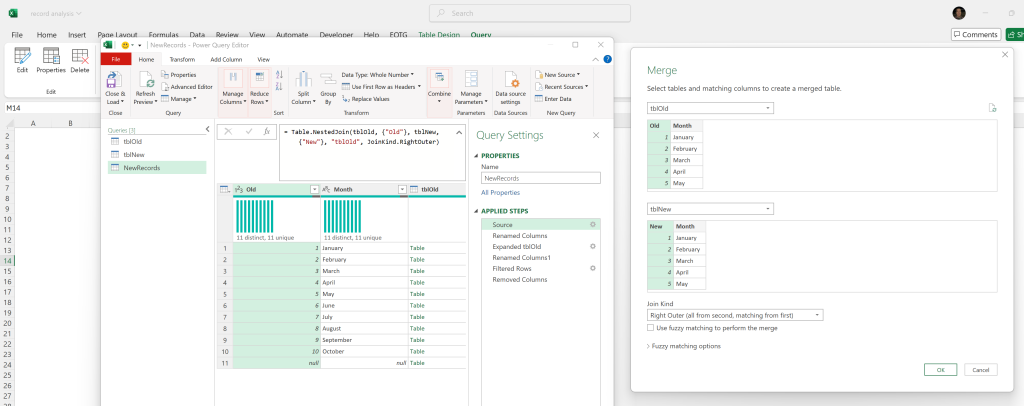
Demo File. Power Query works much like an Access Query. Same joins.
Power Query does the same thing that an XLOOKUP does between Tables, but it does it offsheet, in Power Query, to save steps.
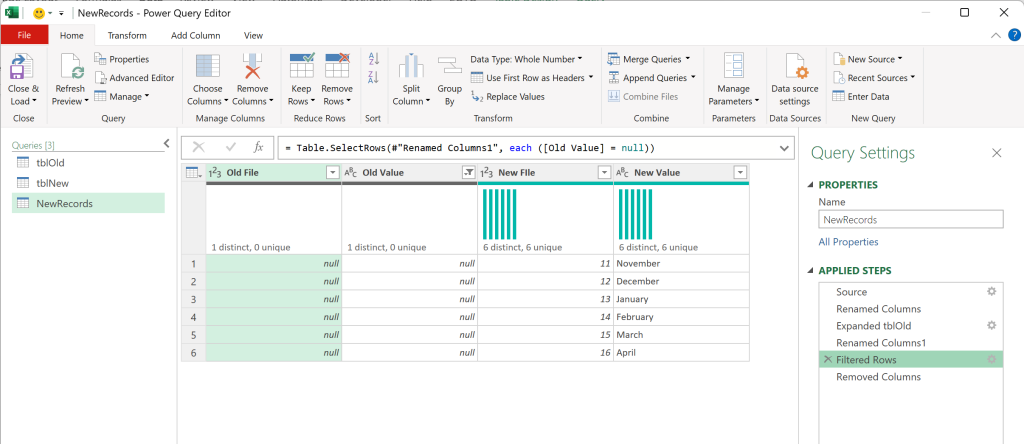
Simple Demo. Filter off the NULLS and we are done. Here are the records.
Many Ways to Find New Records
There are many ways to find new records in Excel. Lookups being one of the most used. But what about massive, external files, what about a one time need, what if the files are too large to open in Excel?
- For this simple example, Power Query is clearly the optimal solution.
The Microsoft Excel XLOOKUP finds New Records
But that is an onsheet function, and we are trying to avoid that. Hence the use of Power Query.
Sure, you could easily use the XLOOKUP, and deal with file size and all, or just use Power Query.
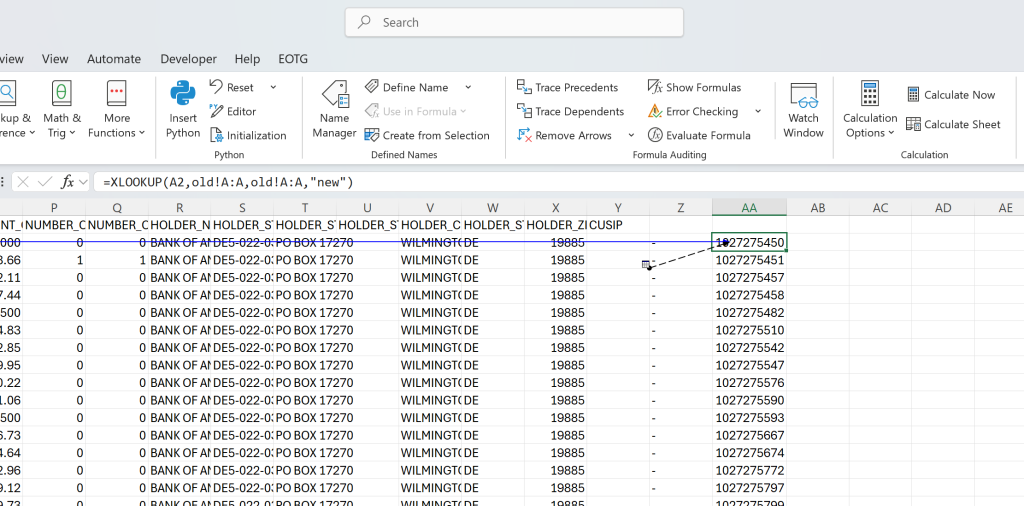
The XLOOKUP is great for finding new records. One of the best options. Right after PQ.
Example 2 – Consolidate Range Data Across 1,872 Tabs, in 36 Files
This was not a pretty one. All the client wants is a single horizontal report, with a filter for year(s); A quick Pivot Table on the output. But the data is in ranges, across hundreds and hundreds of tabs, in multiple files. ouch.
The Situation:
- Three Excel files per year
- 52 data tabs per file
- Range data, no date attribute, not named
- 12 years of files
- Wants all of the data in one source for easy ad hoc analysis.
Everyone does this, and this is the cause of the problem.

Do NOT do this. Like data goes in one Excel Table.
Enter Excel Tables and Power Query
If the data was in one Excel Table, the client would not have needed help. However, Tables were not used, thus complicating the solution.
98% of Excel users do this; like data across tabs and workbooks, in ranges. terrible.
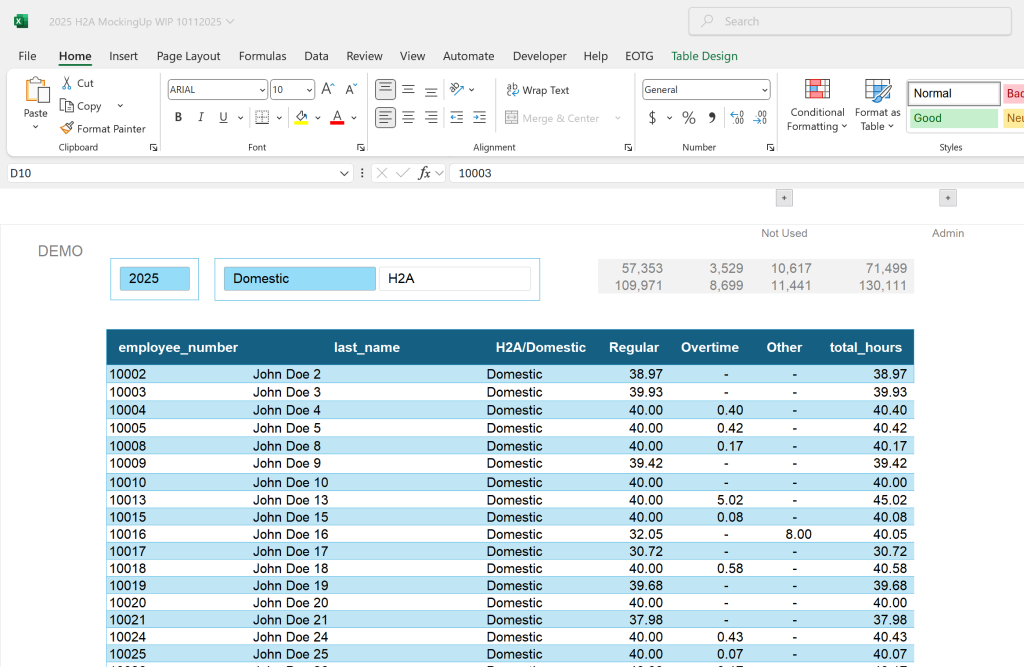
We put all of the data into one Excel Table. Problem solved.
Power Query Transforms Your Data OffSheet.
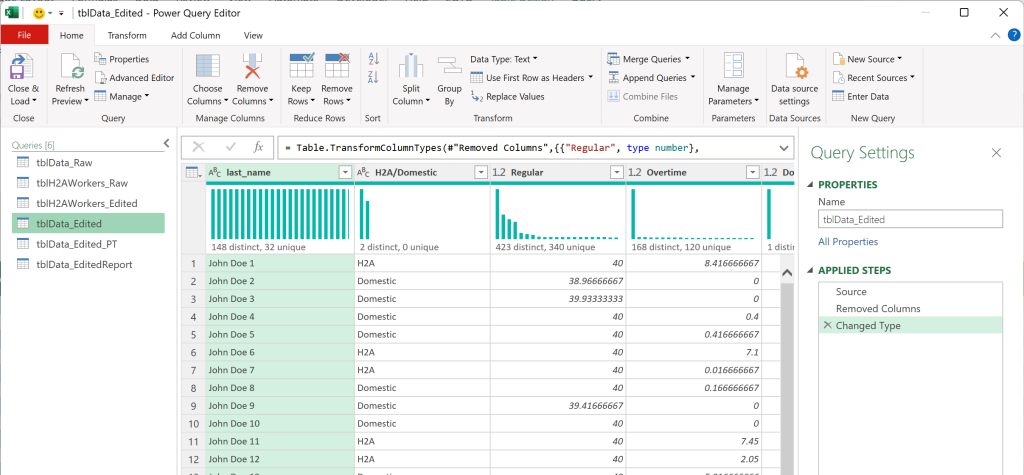
Here we use Power Query to reduce the effort in Excel 365.
Power Query Tables look just like Excel Tables, but they REFRESH. aka, read-only.
Power Query Tables are based on Excel Tables

Put the data into Excel Tables, use Power Query to produce the output, here a Power Query Table.
Load the Power Query PT directly.
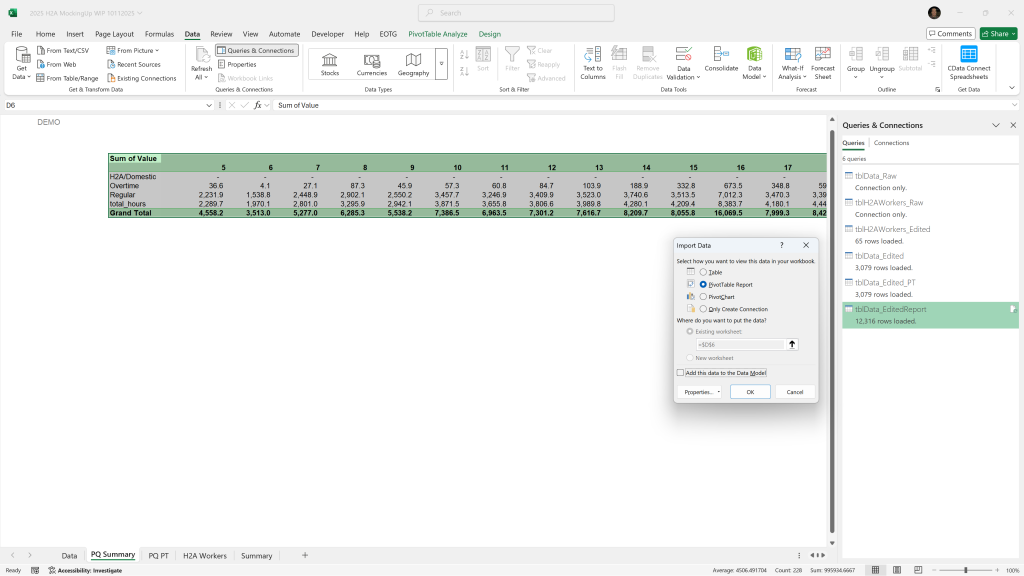
Power Query output being sent directly to a Pivot Table.
Power Query will create a Pivot Table, no need to load the Table to the sheet. Save a step.
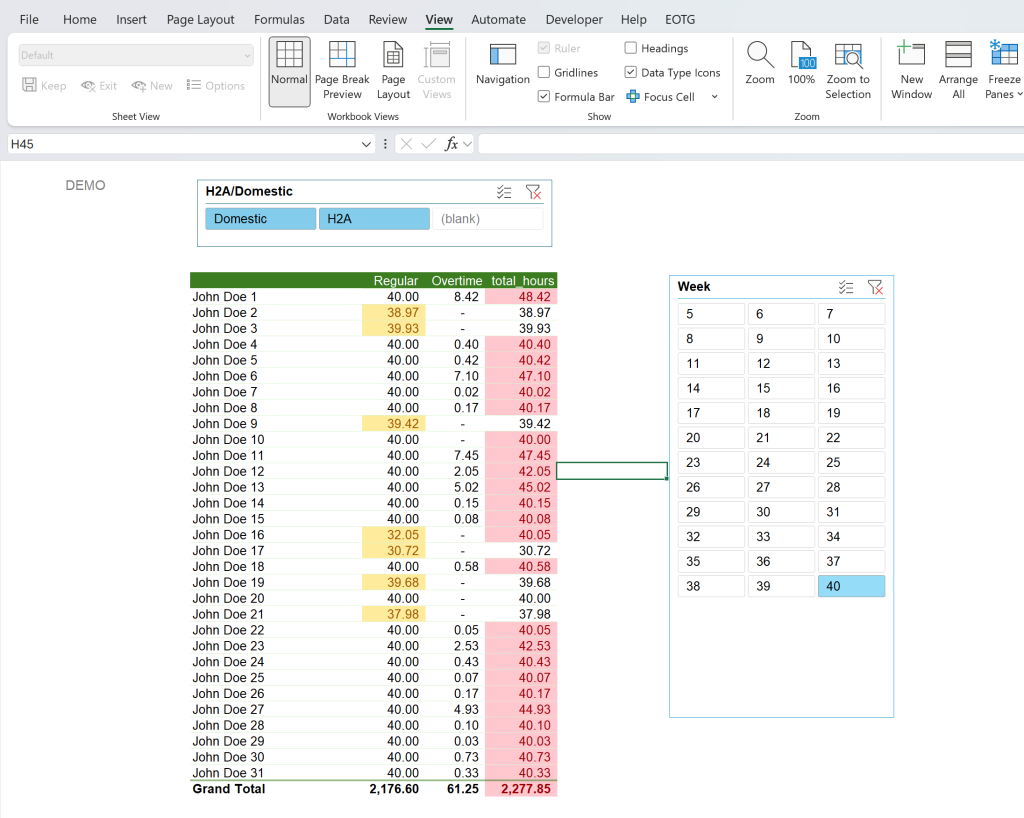
We create Pivot Tables in Power Query, not onsheet. We save a step.
Super simple output, if your data is in one Table, and not 1,872 tabs, 32 files.
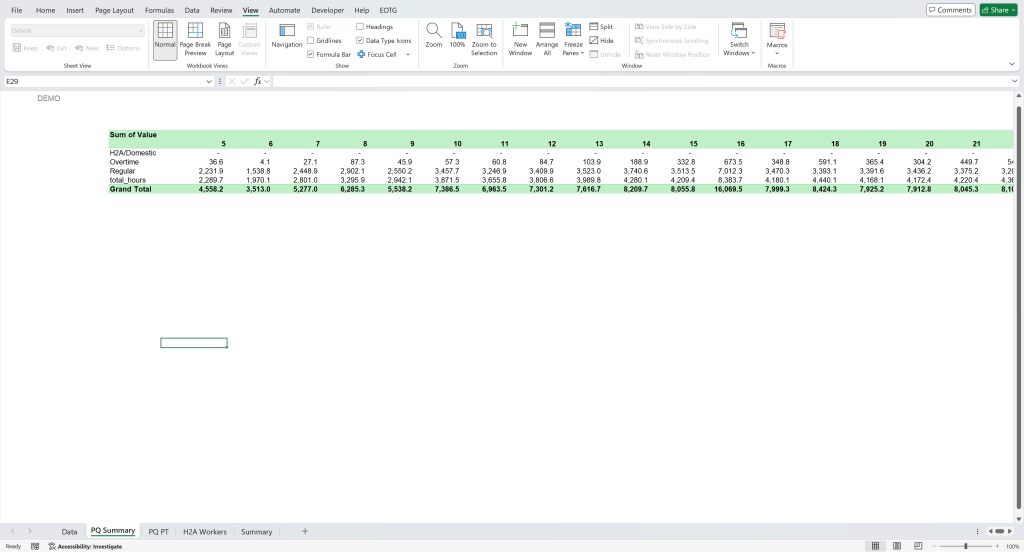
This is the output the client wanted. Power Query really simplifies Excel programming.
Excel Tables and Power Query Simplify the Solution
There are several ways to do most things in Excel. Having your data in proper Excel Tables really simplifies your options. The you can use Power Query, the HLOOKUP, PIVOYBY, etc.
Best Advice: Avoid ranges like the plague; use Tables, simplify everything. PQ, DAF’s, Pivots, Code, all work better with Tables.
Conclusion – Quick Power Query Solutions
There is no arguing that the use of Power Query by professional developers is on the increase. Seems to be what everyone is talking about, and for good reason. Leveraging Power Query in Excel 365 solutions cuts development time, dramatically. I know, I do this daily, and if I use PQ, I can usually cut 66% of the effort. Of course, this is if I use the DAFs and not the legacy, one cell, one function approach.









Leave a Reply