

Custom Excel 365 Solutions Take a lot of Experience to Program
There is a huge difference between fixing an existing Excel workbook and building a new one from scratch.
~ Knowing how Excel works and knowing how to build a 100% automated & Integrated, forward-looking, 100% custom solution, in Excel 365 for Teams are not the same thing, no disrespect ~
Knowing how PIVOTBY works is one thing, knowing how to leverage Excel Tables with Power Query in a custom Excel 365 solution that you are building, for concurrent users on Teams, that is a whole different game.
Here, knowing Excel at the expert level is not the most important thing, that just gets you the consultation; knowing everything else is.
You do not work there, you know very little about their company, and you have to provide a fixed-bid quote in hopes of getting the work, based on a 45-minute conversation, and possibly in spending 2-3 hours reviewing their files, if they have any.
~ This is not easy folks – this takes decades of experience to get right ~
If you really think you can quote those hours you are a smarter man than me; our solutions are not based on hours, but on the deliverables, regardless of the number of hours, meetings, revisions, etc.
We sell solutions, complete solutions. Once our client accepts the quote, hours are meaningless, ; we then look at Google Stars and repeat projects and referrals – we become your partner, 5-Star custom solutions are our focus.
Custom Excel Development from Scratch is Hard – especially if you do not work there
You are starting with a blank slate, for a firm that hired you, you do not work there, you do not have company knowledge, and that folks is not easy, what do you do, where do you start? It is a skill that takes decades to perfect.
Let me rephrase that, custom Excel Solutions take a lot of experience to program, if done properly. Anyone can create an Excel file that works. But that does not make it optimal.
Optimal Solutions: We want our solutions to be as automated as possible. Our focus is to reduce the effort of the user. The only changes to the file should be changes to the data.
Knowing the User: It takes a long long time to see all the things the users will do to your file. Best practices means you overcome those potential challenges before they happen, through prevention. For example, do not code to the Sheet Name, rather use the Code Name of the Sheet, as users love to change the name of the Tab, this will prevent the code from crashing.
To build an optimal solution in Excel 365, you must have a lot of programming experience, decades of it, a lot of passion, and the willingness to constantly learn what is new, and importantly, and how to apply to your custom Excel solutions.
A willingness to stop using what is old, and use what is new, if new is optimal, for the current situation.
Best Practices are learned through trial and error over decades; practice practice practice. Push the limits constantly. Constantly adjust your solutions as you learn what is new in Excel 365.
It all Starts with Design, Based on Experience
Before you ever reach for the keyboard, sit back, grab a pad of paper, a pen, and think. What is it I hope to accomplish? What do they need? What is their environment? What challenges do I face? Is the user needed in this solution? If so, how easy can I make this on the user?
Can I Fully Automate this as in Integrated and Interactive Solution?
It all starts with thought. Usually after many live conversations. The more you talk up front, the less rework you have to perform later.
Sometimes I feel like a dentist, pulling teeth. Where is your data, what columns, do you have other data sources, what about ……..
Ask any of our clients the questions most often asked, data and columns, over and over and over, as they always find new data sources or needs.
Possible Pre-Project Topics:
- Version of Microsoft Excel to be used.
- Excel 365
- PC
- Mac
- Other
- Purchased versions.
- Environment
- Desktop
- Teams/SharePoint/OneDrive
- Excel 365
- Number of Users
- Number of Files
- Use of Power Query
- Use of Macros, M-Code, Office Scripts
- Data Sources
- Desired Outputs
- Frequency of Updates
- What is the size of the Excel file
- Keep it under 10 MB.
- How much Data is there – This is Excel and not a Database.
- This determines a lot of what you will and will not be able to do.
- Excel files with too many onsheet calcs take minutes to open, longer to calculate.
- Use Power Query instead, to optimize the solution, to minimize the onsheet Excel functions.
- Excel files with too many onsheet calcs take minutes to open, longer to calculate.
- This determines a lot of what you will and will not be able to do.
Where does the Data Come From ALWAYS Leads our Thoughts in Design
When we look at a new project, we look at three things. 1) Where does the data come from, what do I need to do with it. 3) What output do they want, need. 2) How do I produce #3 based on #1.
- Data Sources
- Data comes from everywhere these days.
- Excel files, Database Files, CSV files, Text Files, PDF Files, Power BI, Online Data, Typed data
- External Data
- Internal Data
- Excel files, Database Files, CSV files, Text Files, PDF Files, Power BI, Online Data, Typed data
- Data comes from everywhere these days.
- Programming Effort:
- Combination of: Tables, Power Query, Dynamic Array Functions, Code
- Desired Outputs
- Excel Dashboard
- Master Workbooks
- File Exports
- Reports & Analysis
- Templates
- Trackers
- Source for other files
How the data comes in also determines how we interact with it, and ultimately, what we can do with it. Everything starts with the data.
So the first step is to look at all possible Data Sources
Where does their data come from, how easily can I access it?
Most clients do not realize that they do in fact have access to electronic data, aka, soft copies. Hence they type. But I have found, approximately 80% of the time, at least some of their data is available in an electronic format, usually in an .xlsx or .csv format.
There are so many sources of data, make sure you are leveraging them.
- Other Excel files.
- CSV files
- QuickBooks, Sage, ADP, AWS, etc., Downloads
- Power BI
- etc
I know, easier said than done, but this approach will save you a considerable amount of rework.
Once you have identified your data sources, you can move on to the next step, testing those data sources, in Power Query
Do not move on to the next step until you have exhausted this step. 80% of the time, you will find electronic versions of their data. The goal is to eliminate the effort of the user.
Next Step is to Test the Data Sources in Power Query
If you are using an external data source for your file, make sure that the format of the file does not change with each download. The format really should stay the same, it simplifies automation.
You will need to bring each of the Tables into Power query, to test them to see how cleanly they come in, to see how much effort you will need to make, in Power Query, to Transform the data. At this point, this is simply a test and these efforts will not be saved.
At this phase we are still looking at the data in a Table format. How much Transformation is needed.
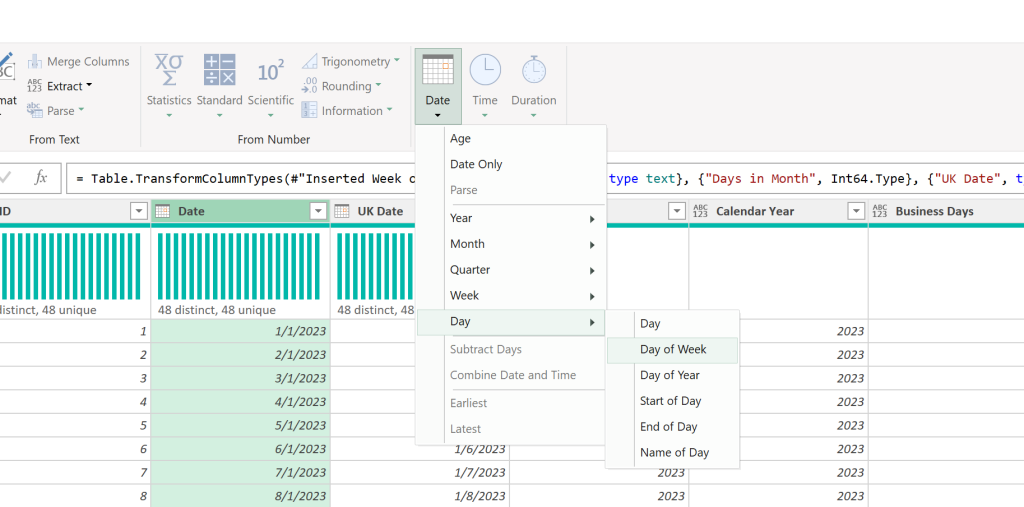
Power Query is our favorite tool in Excel 365.
Once you have verified that the data comes into Power Query cleanly, you can move on to the next step, evaluating the Columns in the Table
It is important to determine the columns needed, to produce the output. We spend a lot of time on the next step. Do not rush through this step.
Next Focus on the Columns in the Excel Table
Before you proceed with your work, work with the client to determine the columns to be used. Which can you remove, how many will the programmer need to add. You will want to do this before you take the Tables into Power Query for their Transformation.
Catching New Columns Early: Surprisingly this always takes time, there are always changes, always, so the key is catching the changes as early as possible. You will not catch them all.
If you built it right, the changes will flow through the solution, so no worries on needing to make changes late in the build. Power Query really makes this easy.
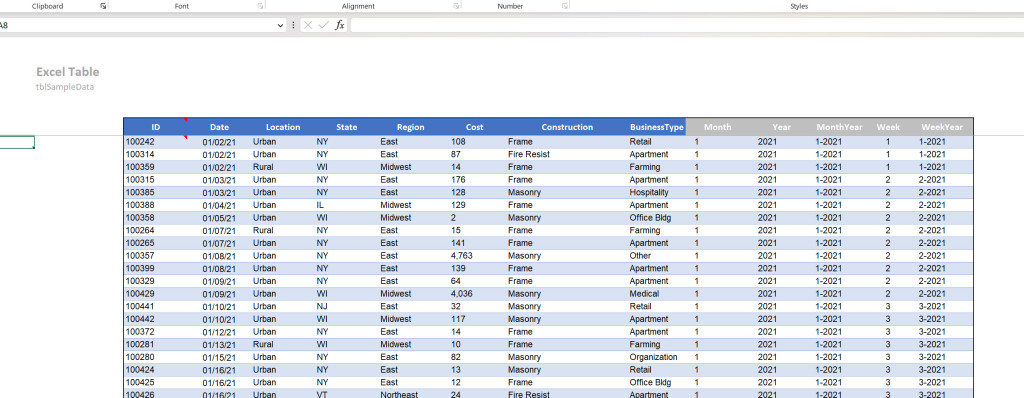
Get the Columns correct before you do anything else.
Excel Table Considerations
Excel Tables do a lot more than hold data. The data in Excel Tables is interactive, if built right. Your data is trying to tell you something, listen.
You want to determine the:
- Columns
- Column Headers
- Column Order
- Data Types
- Really push back on the client, force them through this step.
Do not move on until this step is complete. This is the first step of the project.
You will want to consider what the columns do.
- Hold Data
- Contain Calculations
- Contain a CheckBox
- Contain a DropDown List
- Allow manual Data Entry
You will want to consider adding the following to your Excel Tables:
- Data Validation
- Conditional Formatting
- Cell Protection
- Named Ranges
- Slicers
- Totals Row
- Grouping
- Event Code
- etc
Getting the right data in the right tables in the right format is the most important part of a project
Second Step is to Look at the Outputs
Do I have all of the data that I need to produce the results that they are looking for?
Can I produce the desired outputs, based on the Excel Tables developed?
Usually the answer is no, you will need to add more Tables, more Columns, more Lists, etc.
This is good. You will likely discover one or more electron versions of data they did not know they had.
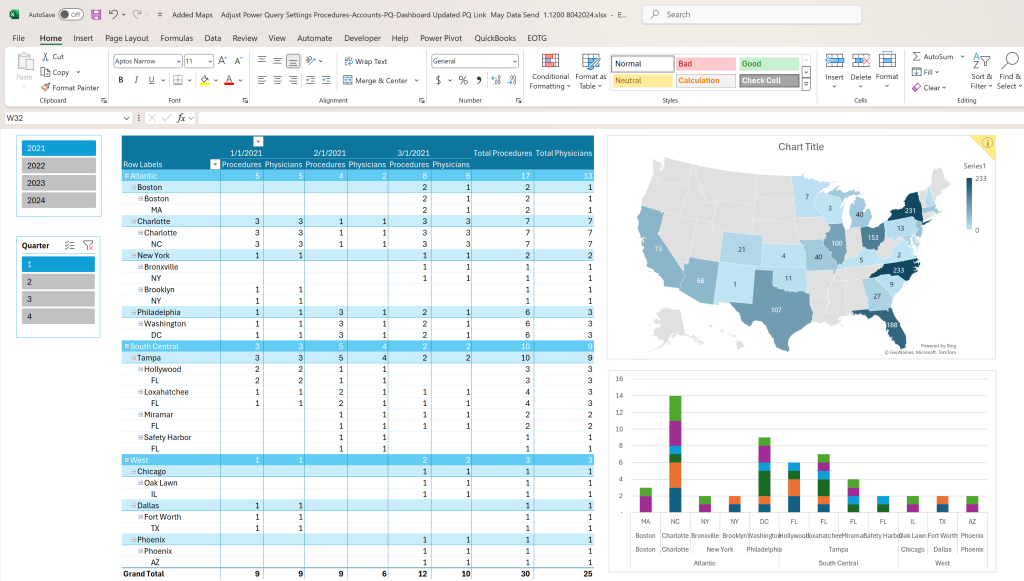
Excel 365 Dashboards are more powerful than ever.
Important Considerations:
Do they need to report on Region? If so, do I have Region in my data Tables? If not, how can I report on it?
Do I need Fiscal Year or Calendar Year? Do I have a Periods Table with this information readily available?
How many Lists do I need, so that the user can Select an Item versus type whatever they want.
These are the important considerations.
Once you find missing data sources, go back, evaluate them, and add them.
Do not move on to the next step until you have completed this one.
Third Step is to Produce the Outputs
This is where you will spend the majority of your time on the project, this and on the user interface.
Based on their environment, their users, their applications, their budget, their needs, what do they need in this solution.
What do they want to see in the Dashboard? Pivots, Dynamic Arrays, Charts, Graphs, Reports, Analysis, etc.
This is where you experience really comes into play. Do you know what works best, in this client’s situation?
Sometimes one way works better than another, given the client. For example, do you:
- Pivot Table, Pivot Chart, with Slicers.
- PivotBy Function.
- Power Query Pivot output.
- Dynamic Array Functions.
- Legacy Functions.
- Use the one that requires the least effort from the user.
So which do you use? All three provide the same output, but how you interact with it is different. Hence experience. Given what we know about Dashboards, what does the client want to see? Do we want to use Slicers, Drop-Downs, etc. How will the client interact with the solution.
It is not about what is easiest or which method we prefer, it is about what works best for the client. How far can we push automation; is the user needed.
That is the question, and Best Practices is the answer. That takes a lot of experience.
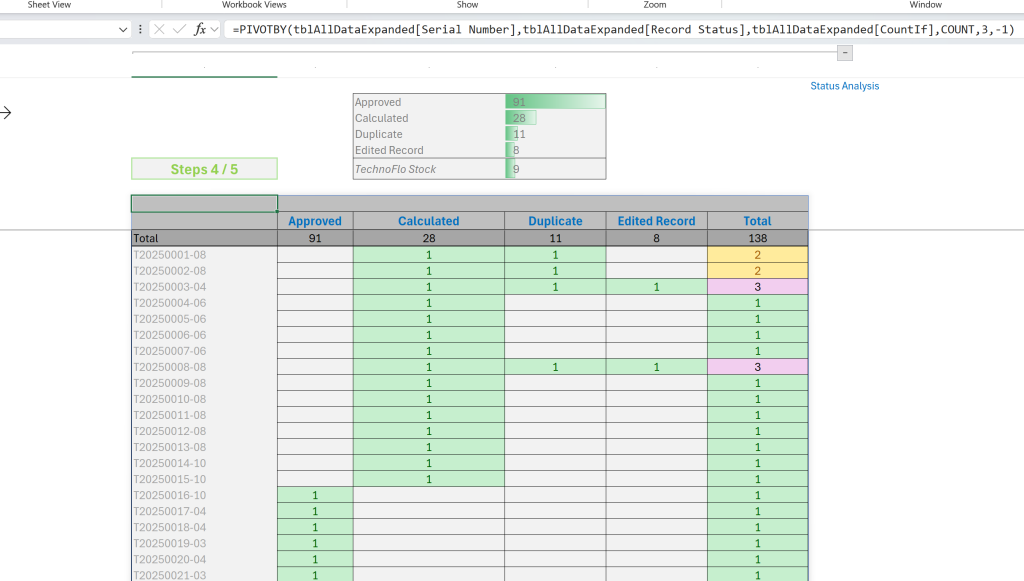
Developer columns, Status, Record Date, etc.
The third step is where the programming comes into place.
You know the desired output, you have the data in place, now how do you access that data, to produce the outputs? Use Index/Match, Direct Cell References, Power Query, PivotBy, Pivot Tables, so many options.
Expert’s Advice: Go with the fully automated methods.
There have never been more options available to Excel programmers.
How far can you push automation. How integrated, and interactive, can you make it. That all comes down to design. The best designs are built on best practices. That is learned through experience.
Current Excel 365 Solutions are based on the following:
- Power Query for Data Transformation & Manipulation
- Dynamic Array Functions ( XLOOKUP, LET )
- PIVOTBY & GROUPBY Functions produce a full Report.
- Pivot Tables & Pivot Charts
- The center of Excel Dashboards.
- Legacy Functions ( Index/Match, VLOOKUP )
- We recommend minimal use of these.
- Code ( VBA, O.S., M-C0de).
- Mostly used to move data and for the User experience.
You will want to mix and match these, based on the needs of the client.
Excel MVP Quote: VBA really exists now as the tendons and ligaments that connect part of a workbook. It is no longer the muscle.
Developers’ Focus should always be, is this the BEST way that I can do this?
If not, then do it differently. Do it the right way, this should be your best solution to date. Always do your best work.
Learn, Learn, Learn, always learn, always push what you do, can I make small changes in what I do, to produce a better solution. Create demo files, learn what works, once you fully understand the ins and outs of it, then you can use it in your solutions.
Best Place to Learn Microsoft Excel 365 – LinkedIn
The Ultimate Design of your Custom Excel 365 Solution Depends on Multiple Factors
Not just one, so each solution is in fact a completely new design, based on your experience and the clients needs. If you bring best practices to the table, you are in a position to give your client an optimal solution. A solution where we minimize the efforts of our users.
Learning what to do takes time, a lot of time, often decades. You learn programming best practices by trial and error, and by learning what works best, in which situations. There is no short cut.
At Excel and Access, LLC, each time a new Excel 365 Function, Tool or such comes out, we test it. How, we build a new demo model, and why look at the new function or such every which way. What does it do, what can we do with it, how far can we push it. That is how you learn. Once we know that, then we can start to use it in our commercial solutions for business.

Mentoring Microsoft Excel 365 with Power Query for Developers
There are so many ways to do things in Excel, how do you know which to use? Do you start with the Report, or the Data Table?
Do you use Ranges, Tables, Legacy Functions, Dynamic Array Functions, Power Query, VBA/Macros, Office Scripts, M-Code, etc. How do you know?
If your data is in a Table, you can usually use just these functions to reference the data. So start with these five, and if you need to learn others, then do. Start with the basics.
- XLOOKUP
- SUMIFS
- PIVOTBY – Full Report
- GROUPBY – Full Report
- FILTER
- Add a Primary Key Column to the data Table or Query to simplify the Lookups or Joins.
- Add Utility Functions such as SORTBY, SEQUENCE, UNIQUE, TRANSPOSE, etc., as needed.
Best Practices Hint:
Do NOT do this: Do not put the Data and the Report in the same Range.
Do not use Ranges.
Reports read data Tables.
Do not mix the Data with the Report.
Expert’s Advice: Where you start ultimately determines where you end up. Start off on the right foot. Step away from the keyboard and think.
We are here to help. A few hours is all it ever takes. We have demo models and such built just to show you best practices.
Toll-Free: 877.392.3539 | Irvine, California: 949.612.3366 | Manhattan, New York: 646.205.3261
Contact us for a Free Consultation Today
Best Practice Examples
Below are a few examples of better ways to do things. There are so many ways to do things in Excel, finding the best is not always easy. Much of that depends on the client and their environment.
Excel Table Best Practices
ALWAYS use Excel Tables to house your data and Lists.
Do NOT use Ranges; use Excel Tables.
There is a significant difference between accessing a Range or accessing a Table. One is super easy, one not so easy.
Accessing dating via Ranges is much more complicated than if the data was in an Excel Table.
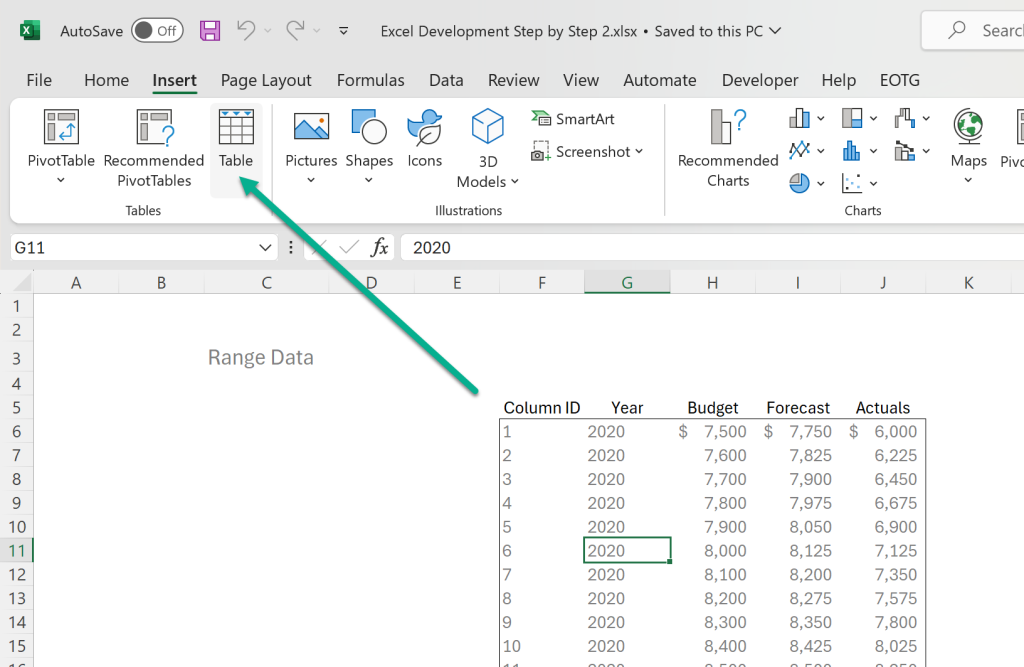
Convert your Ranges to Tables
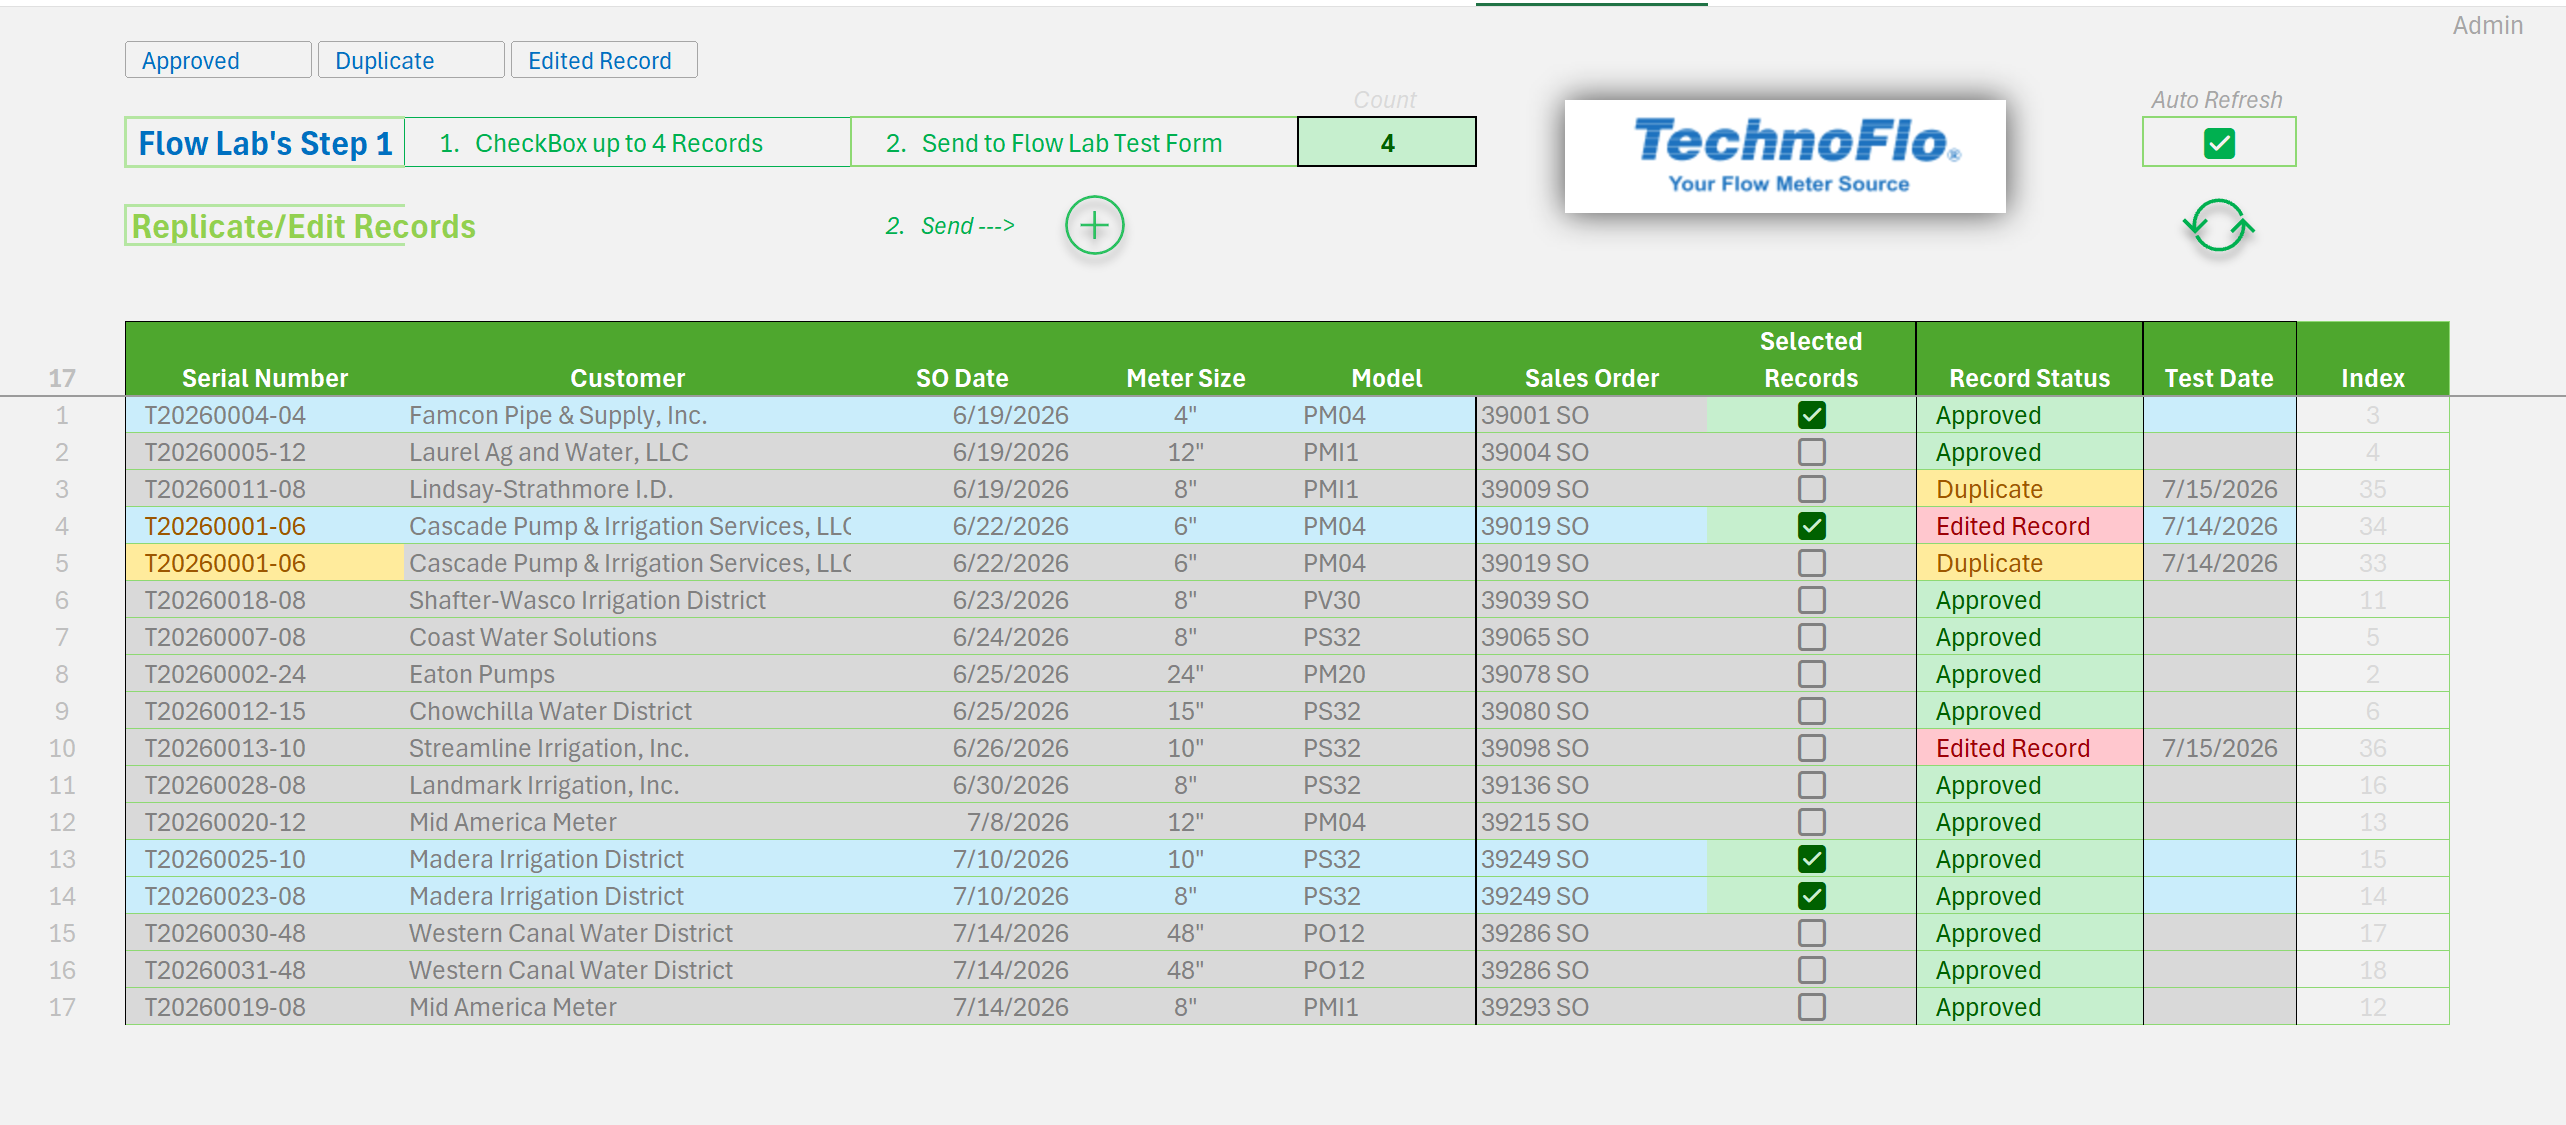
Try This: Add a new Column to your Power Query Table, label it Filter, add a Checkbox to it, and allow the user to use that column to filter the data in the Table for Slicers, Power Query, and Functions.
Best Practices: The CheckBox is a great GUI Tool, we love it, it changed how we program, literally, we use it as much as the Drop-Down Validation Lists and Slicers. Excel 365 Tables are Interactive when done right.
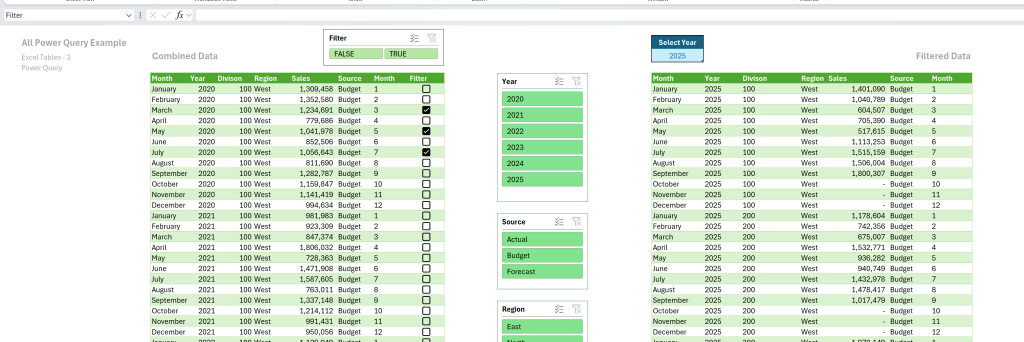
Queries read Queries, Filter your datasets for ease of use, reduce or eliminate onsheet functions.
Power Query Best Practices
Power Query is where Excel 365 is now done. Much of the efforts in the past, onsheet calculations, those are now done in Power Query.
Excel Expert’s Note: Power Query in Excel 365 allows you to load results to a tab, not formulas, which the user cannot damage. It is read-only, delete it, and it will Refresh.
Expert’s Advice: Use Power Query to Filter a Dataset before it goes onsheet, so that you can simplify your calculations, as only the data of interest is in the Table. You can use DropDown lists to allow the user to select the filter, or it can be automatic.
Try This: If you need to sum 2025 data, in a Table with 10-years data, use Power Query to only show 2025 data, then use the value in the Totals row, no need to write a function.

Pivot Table per-filtered to 2025 via Power Query, only load the desired results to Sheet.
DAF Best Practices
If you are going to use a function, start with these. If you cannot compete your work using the newer functions, then go back and use one of the Legacy functions.
Our approach is to use as few onsheet functions and code as possible in our solutions. As much as possible in Power Query and Tables.
Sure, Index/Match, VLOOKUP, you love those, but why did Microsoft decide to spend so much money on the new calculation engine, on the new functions such as PIVOTBY?
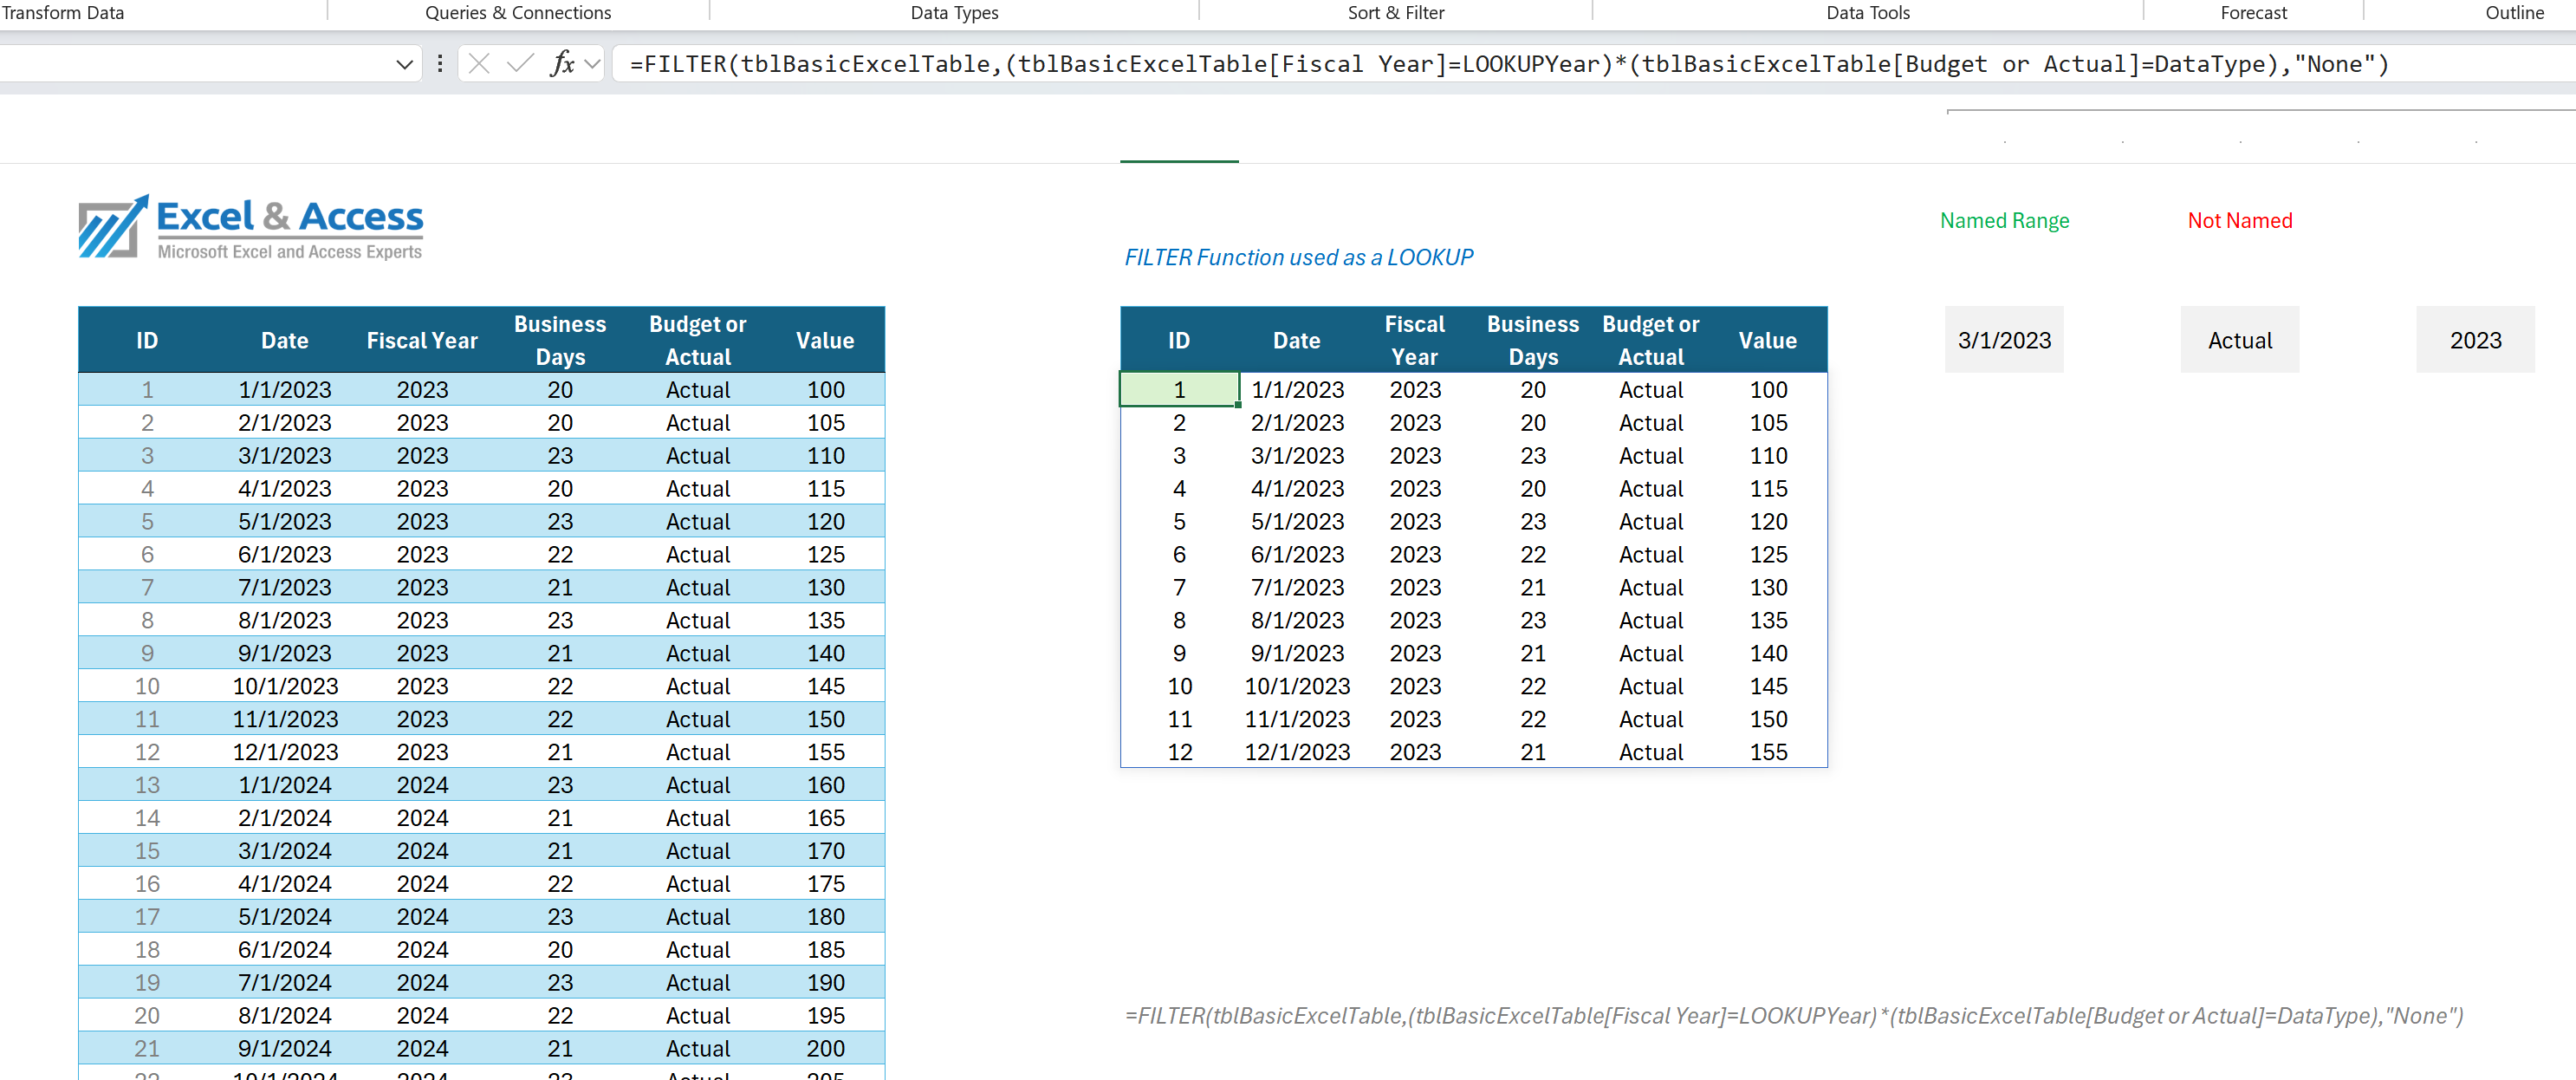
Why do the two newest functions produce an entire report with headers, totals, sorting and filters? One Dynamic Array Function, no embedded functions, one cell, a Dynamic Report.
The way Microsoft Excel 365 is programmed has and is changing. We can take advantage of these changes, for our client’s benefit, or we can stick to the older methods, as they still work.
Gas powered or electric, that is the analogy here. The best mechanics can work on both, at the expert level, here MORE is MORE.
Make your functions, both DAF and Legacy Spill, for best results.
Try This: Use that # in your Excel functions. That greatly simplifies how you write functions in Excel 365.
In the image below, you will see the future of Excel functions. Note the use of the # in the function. Simply point that at a Spill Cell.
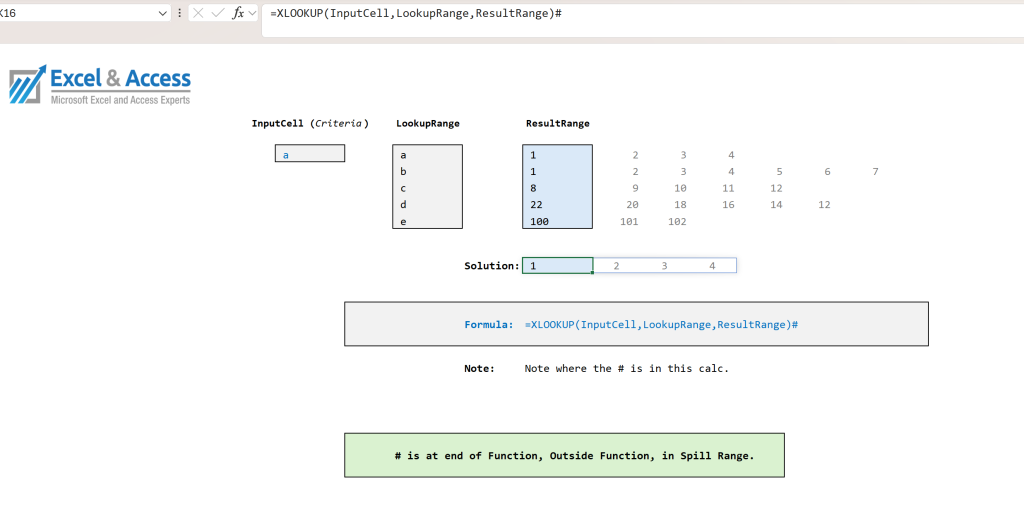
Notice the use of the # in the function. If you do not know what that means, then you do not know Excel 365.
Conclusion: Custom Excel 365 Solutions Take a lot of Experience to Program
Being an expert in Excel is not easy. Designing custom solutions from scratch, that is a skill that takes decades to master. Along the way you will learn best practices.
There are too many ways to do things in Excel, most of them are far from efficient or optimal.
How do you learn what works best, usually pain, you are developing a solution, and a challenge presents itself. It might cost you an hour, it might cost you days, but it will teach you. This is where you learn, this is where you get better, this is where your solution’s get better, if you are open to learning.
Toll-Free: 877.392.3539 | Irvine, California: 949.612.3366 | Manhattan, New York: 646.205.3261
Contact us for a Free Consultation Today









Leave a Reply