


Excel Data Driven Solutions in 2026
 Every new Excel solution we build starts with the Data, and it flows downstream from there.
Understanding your data, where it comes from, cleaning it up, making sure you have all the columns you need, that is the first step in any custom Excel solution. The last step is writing the code for the user experience. Reports, they come closer to the end than they do the beginning. There is a flow to design.
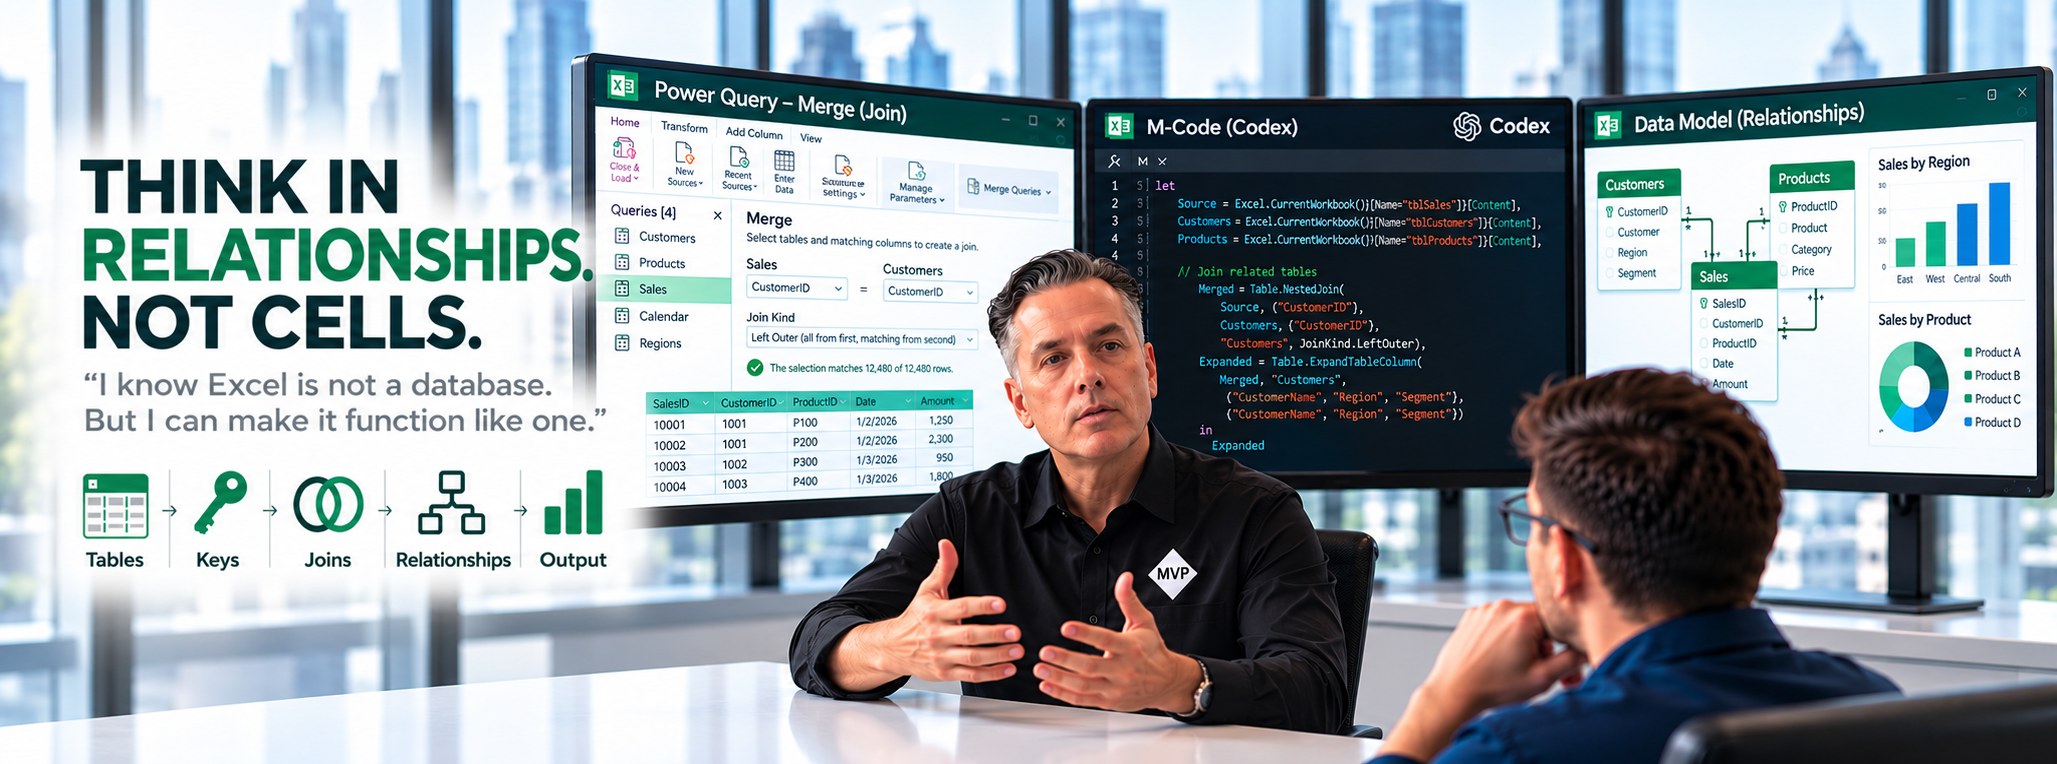
~ FLUID Excel Solutions, the data starts at the top and it flows down ~
Do NOT start with reports, analysis, or functions, that comes more towards the end, once the data is as it should be.
There are steps, even phases, to Excel development. Here we walk you through them
When we design a new custom solution in Excel, we first look at the data, we then look at the desired outputs. We ask ourselves, is there anything in our output, say Region, that is not in the data? If it is in the output, but not in the data, then we need to go back, and update our data sources to account for this.
Once we have the data needed for the outputs, then we can focus on the programming effort, but not a moment before. So before you ever touch the keyboard, compare desired outputs to data inputs. Do you have everything you need? If not, well, go get it.
Three aspects to Excel development.
- The Data evaluation effort.
- The Output evaluation effort.
- The actual Programming effort.
If it is in the output, but not in the data, then we need to go back, and update our data sources to account for this
Toll-Free: 877.392.3539 | Irvine, California: 949.612.3366 | Manhattan, New York: 646.205.3261
Contact us for a Free Consultation Today

Microsoft has hired my firm several times now. They love our work.
Hire the Excel and Power Query experts at Excel and Access, LLC
Excel Programming Steps & Phases: We Start with the Data, and That Means Excel Tables
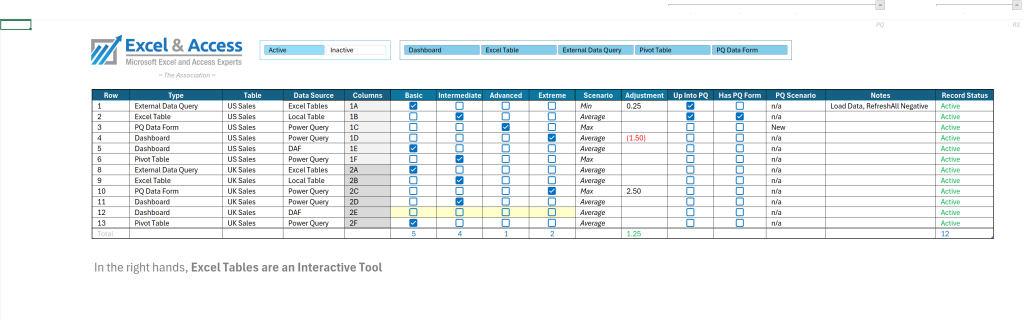
Tables Tables Tables, you really want to get this right, before you take the data into Power Query.
Step 3: Power Query takes the data in your Tables, and it transforms it, into something useful. If your Excel Tables are not complete, any changes to them, will flow into Power Query. You may or may not need to revise one or more queries at that point.
Hence, get your data in order before you move on to the next step.
The Thought Process: Think of a new custom Excel solution as a pyramid, we start at the top, with the data, and we work our way down. Where you start matters; you do not start with reports and analysis.
You start with the data, in Phase 1, and several of the first steps are 100% about getting your data in order.
Excel starts with data and it starts with Excel Tables, Lookup Tables, List Tables, Power Query and the Data Model ( If applicable ).
Phase 1: Combined, Steps 1-4, getting your data in order.
* For BIG Data needs, the data then goes into the Excel Data Model and Power Pivot.
The Steps in Development – Data Driven Excel Solutions
There are specific steps to custom Excel development. If the solution is based on data, then it is even more important to work in steps, and ultimately, in phases.
Rushing to start a report might be exciting, but you are getting ahead of yourself. Paint the car once it has been fully built, not before.
The Phases of Excel Development.
That is how we should think of this, we develop in phases, groups of steps. Phase 1, getting your data in order, is the most important phase, it is comprised of 3-4 Steps.
- Phase 1: Getting your data in order.
- The Data
- Lookup Tables / List Tables
- Power Query
- Data Model ( Optional )
- Phase 2: Building out the solution.
- Data Forms ( Optional )
- Dynamic Array Functions
- Dashboards ( Optional )
- Phase 3: The user experience.
- Code ( Optional )
- Below, we will go over each step, in detail.
Phase 1, Step 1: Identifying all of your Data Sources
This is where it starts folks. Your success or failure starts right here.
Soft copies, most companies have them, but most people are unaware of them, so they type, copy, paste, etc.
Pause, speak with those that you work with, do you have access to electronic data, soft copies, data downloads, etc.?

Excel Tables drive a data driven solution.
Where does your data come from?
Data can come from all sorts of places. Some data sources are more friendly than others, easier to use, we want to locate those, if they exist.
Take your time to determine what data sources are available. This can be a huge time saver.
- External Excel files.
- External CSV, TXT, PDF, etc., files.
- QuickBooks, Sage, ADP, etc.
- Web sites.
- Manually typed into the file.
- etc.
- You really want to take your time on this step, to really think this through. You most likely have soft data available. If so, do not manually copy and paste, rather use Power Query.
Columns – What Columns do you need?
This is critical, what columns do you need in your Excel Tables? Take your time, and think this one over.
Example: Do you need a Status attribute? How about a user Filter attribute, a Notes column?
Does your Table have a PK?
Much to think about, long before we take this data into Power Query.
Do we have all of the data, all of the columns, needed to produce the desired outputs?
Most likely no. We need to match the data in our Tables to that of the reports and analysis. If our reports include region, but our data does not, ……….
Pause: Take a moment, we want to make sure we have all of the data and all of the columns BEFORE we take the data into Step 2, Power Query.
Once you have identified all of your data sources, once you have identified all of the columns needed, then you are ready to load your Tables into Power Query, to Transform your data. This is where the fun starts, this is where the power is.
Phase 1, Step 2: Lookup Tables, DropDown Lists
We use Excel Tables, on the Lists Tab, to create lists for our drop-down Validation Controls.
We use Excel Tables as Lookup Tables, to Merge data, to pull necessary Dimension Data for our Data Tables.
We try to determine all of these in Step 1, but we never do get them all; as we program the custom Excel solution, we will uncover the need for more mapping/lookup Tables, and as we do, we add them.

DropDown Lists are based on Excel Tables.
Phase 1, Step 3: Load Excel Tables into Power Query
Transform Your Data
Here we Transform our data into something useful. Here we make our data as we want it. Not onsheet with functions, but rather right here in Power Query.
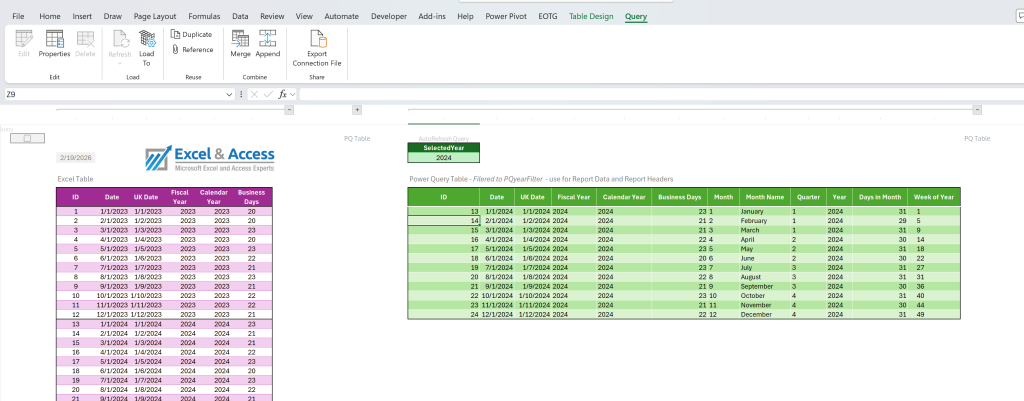
We load the Excel Table into Power Query, we download the expanded on, and Filtered, Power Query Table. Doing as much as the transformation as possible in PQ.
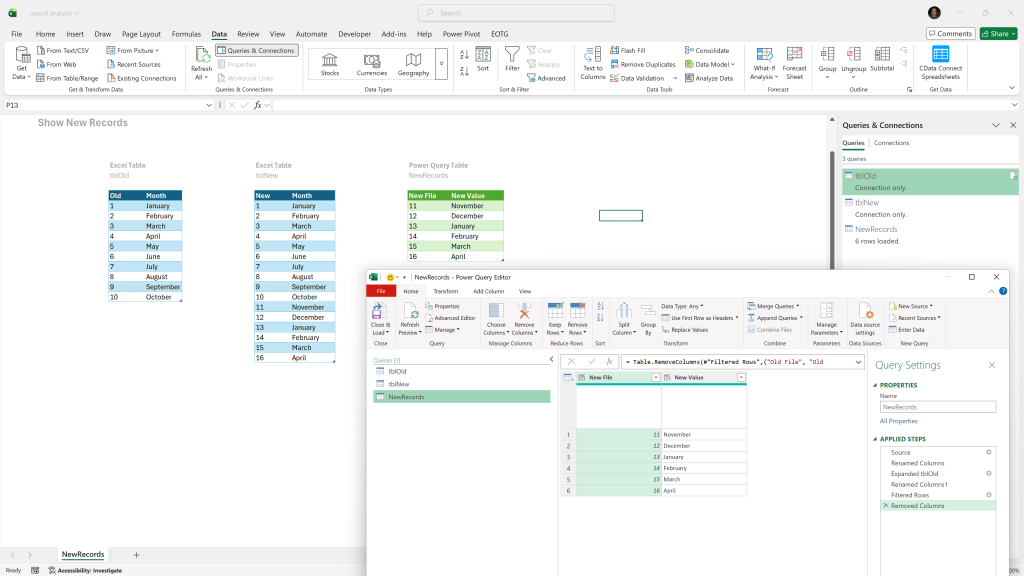
Power Query will do the heavy lifting in an automated Excel solution.
We use Power Query to Stage our Data
We stage our data, so that other Tables, Queries, Pivot Tables, Forms, and Functions can better reference said data.
- That said, the Power Query output does not need to be referenced by functions and such, it can be the actual report and analysis.
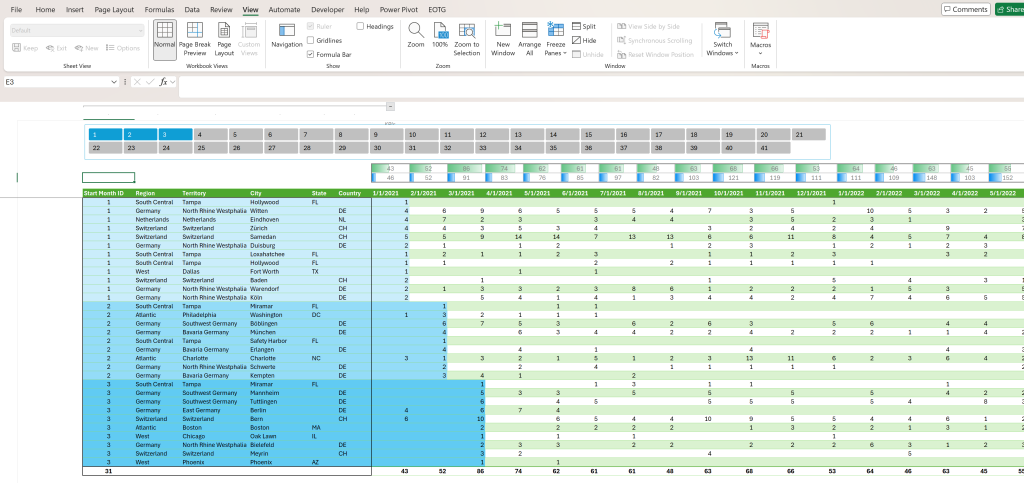
Power Query Reporting Example: Below, Power Query created a waterfall report, based on Slicers. No onsheet functions needed; just PQ and Slicers, now that is POWER.
Power Query Programming Services for Business
Below are some of the ways that we use Power Query to Transform our data.
There are many more things you can do in PQ, but these are some of the most common actions.
- Put the data in order, as we want it.
- Import External Data
- Manipulate Local Data
- Remove unnecessary columns
- Add new columns
- Change the order of the columns
- Filter the columns
- Change column headings
- Sort one or more columns
- Append like data
- Merge Tables and Queries
- Feed the Data Model
- etc.
Phase 1, Step 4: Power Query Populates the Data Model
~ Optional ~
For BIG Data Needs
Optional, most Excel projects do not need to use the Data Model. The Excel Data Model is usually reserved for Power BI or BIG Data needs. Else, you can just use Power Query and Pivot Tables.
But if you have large files, the data model in Excel will be priceless. Power Pivot is like a Pivot Table on steroids.
Millions and millions of rows of data are available in Excel’s Data Model.
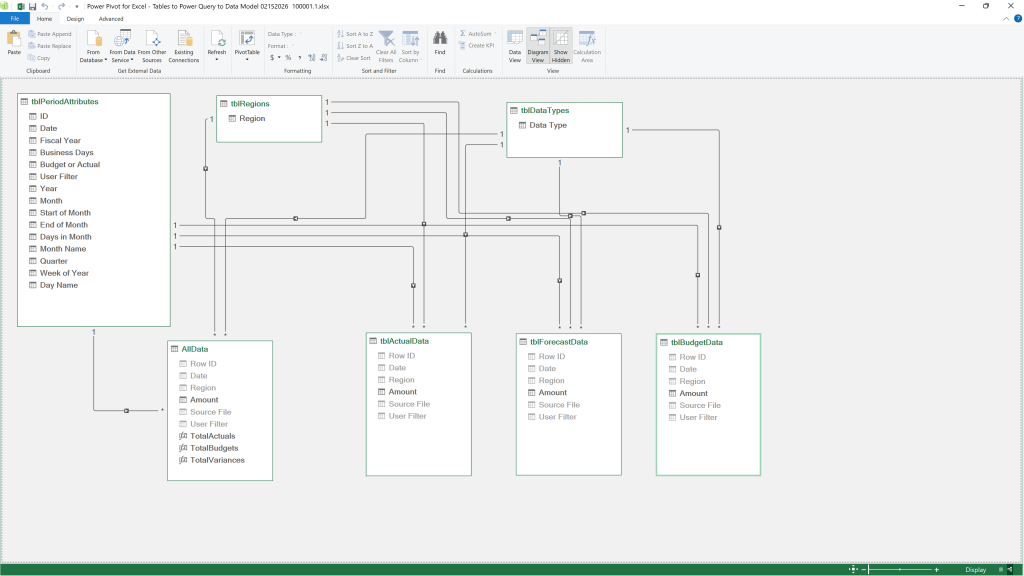
If you have a lot of data, gigs of it, consider using Excel’s Data Model w/ Power Pivot.
Power Query & The Excel Data Model
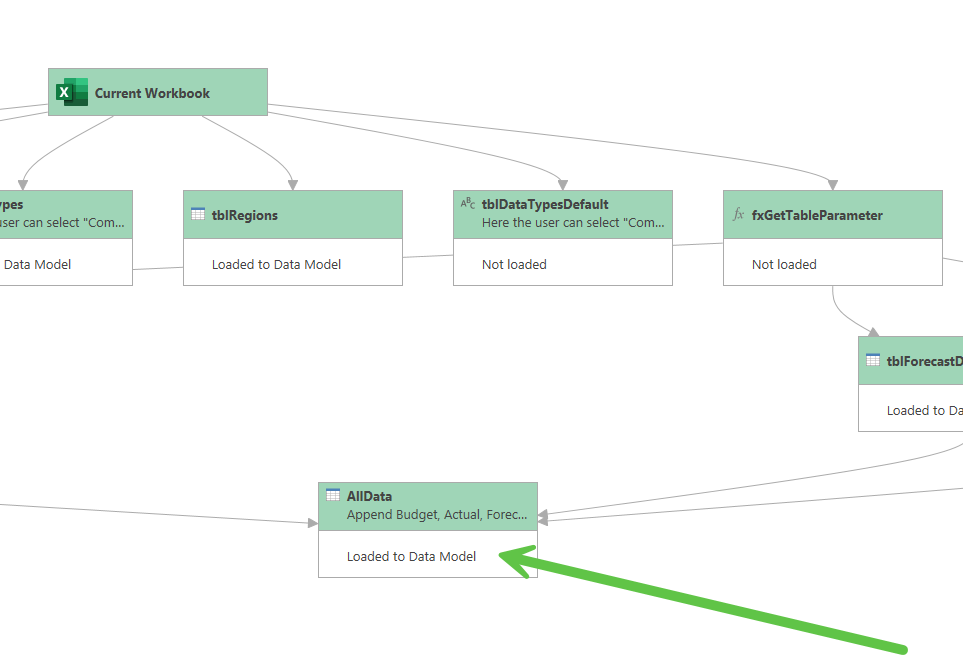
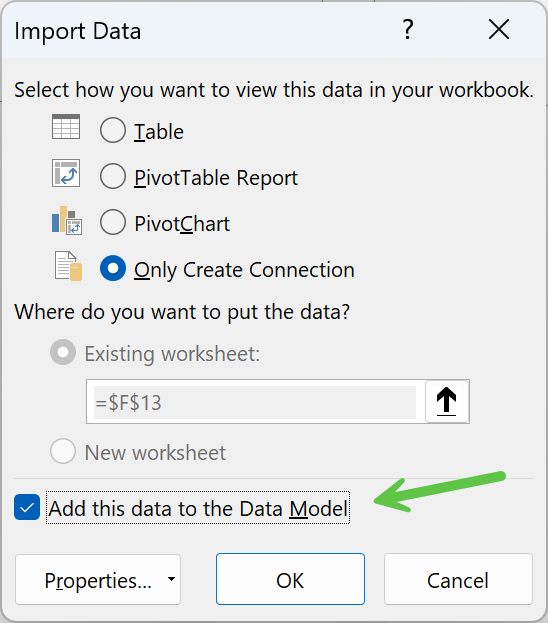
Here we continue with Power Query, writing the Queries, to be used as Tables, in Power Pivot. We build Data Tables and Dimension Tables, in Power Query.
We then add them to the Data Model. Power Pivot and the Data Model then take over, and we complete our work there.
Power BI:
We do not want to use or to pay for Power BI, rather we want to use Power Query & Power Pivot inside Excel 365. Much of what Power BI does, at a smaller easier level.
- Power Query
- Power Pivot
- Power View
We do not want to use Power BI, we want to use Power Query and the Data Model, Power Pivot. Sure, not as powerful as Power BI, but more powerful than Excel.
Phase 2, Step 5: Data Manipulation Forms
~ Optional ~
Power Query Tables used as Data Forms
Optional: If the user needs to manually enter data, how and where do they do that? Do you allow the user direct access to the data Tables?
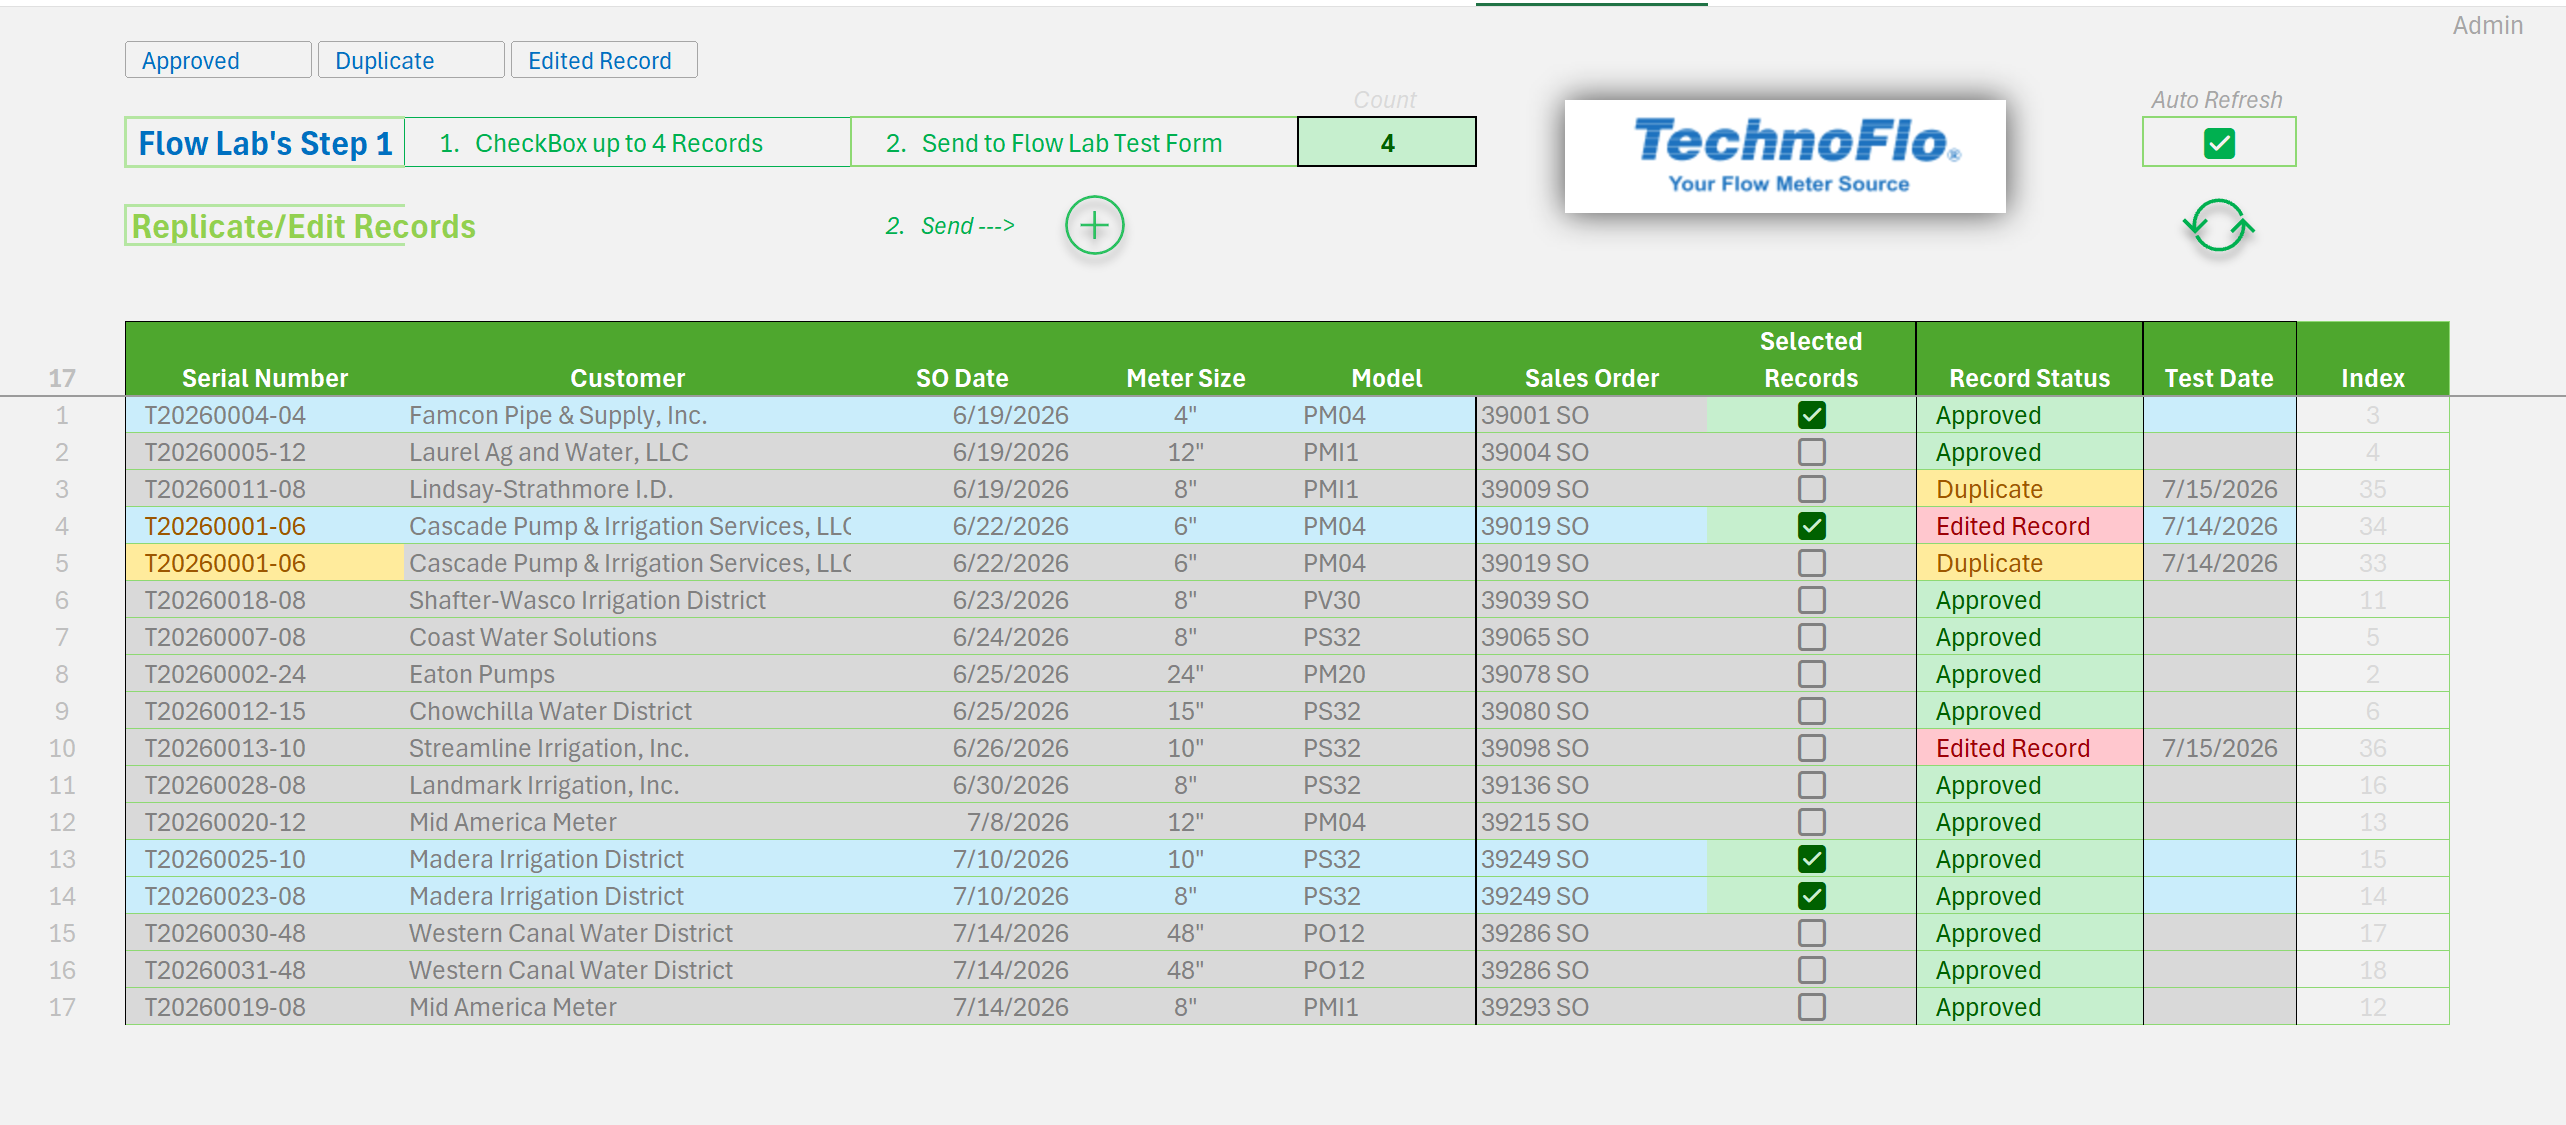
If you want to automate data entry, while keeping the users out of the data Tables, using Power Query Tables as Data Forms is a very powerful way to go. No need to use UserForms.
Power Query Tables as Data Entry Forms in Excel 365
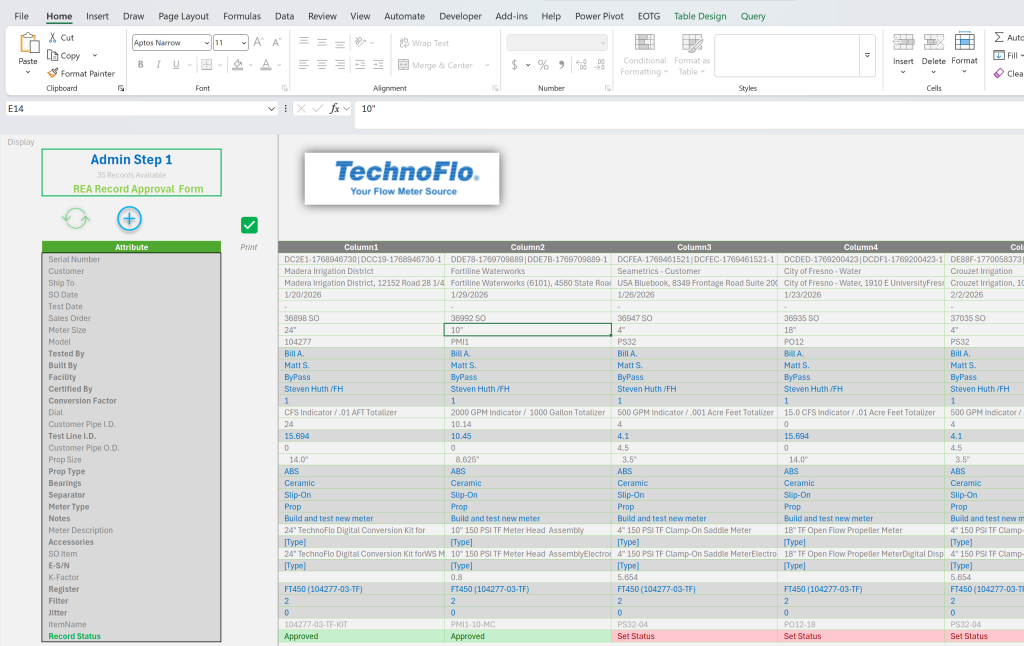
Power Query Data Forms are a great way to add data to hidden Tables.
Phase 2, Step 6: Dynamic Array Functions
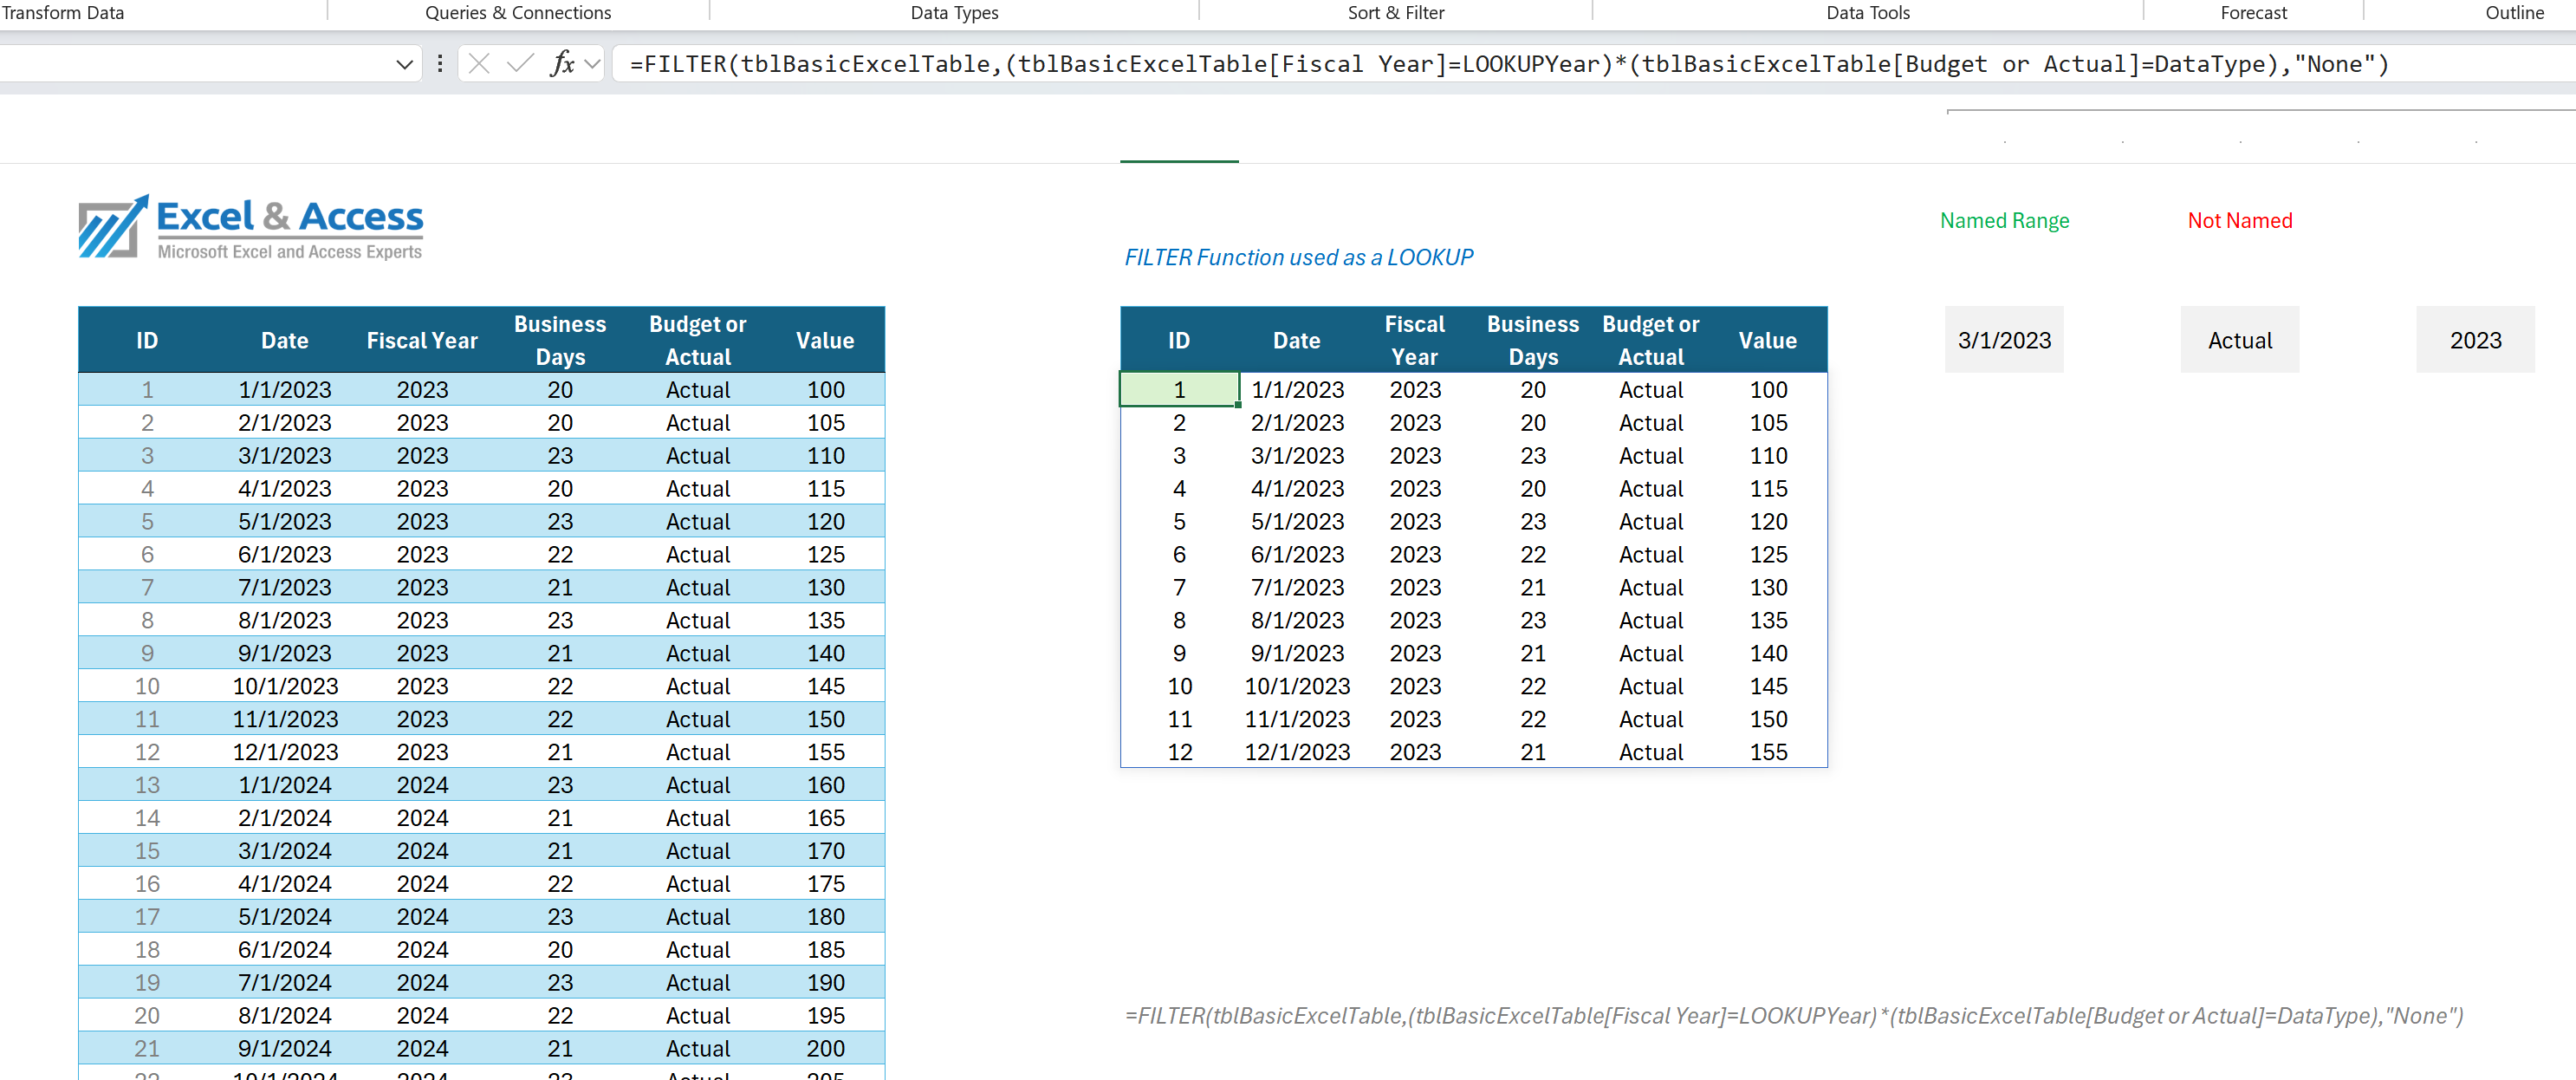
Time to use GROUPBY/PIVOTBY, XLOOKUP LAMBDA
It took time, but we finally got to the step where we write onsheet Excel functions against our various Tables and Queries.
Using as few functions as possible is the goal.
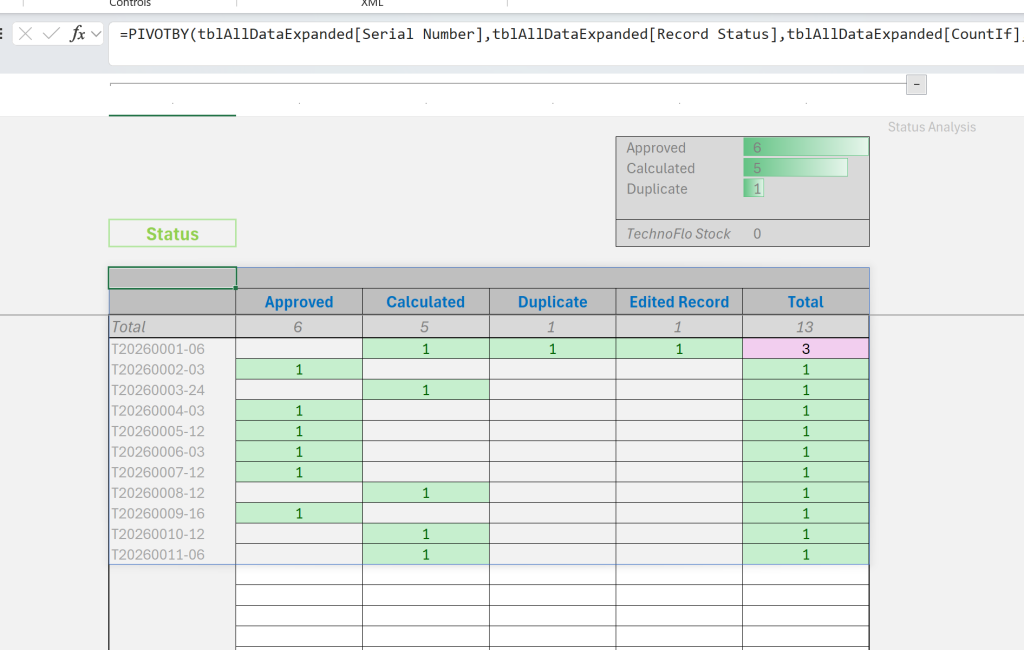
PivotBy, GroupBy, these two new DAFs will create an entire report, in once function, in one cell.
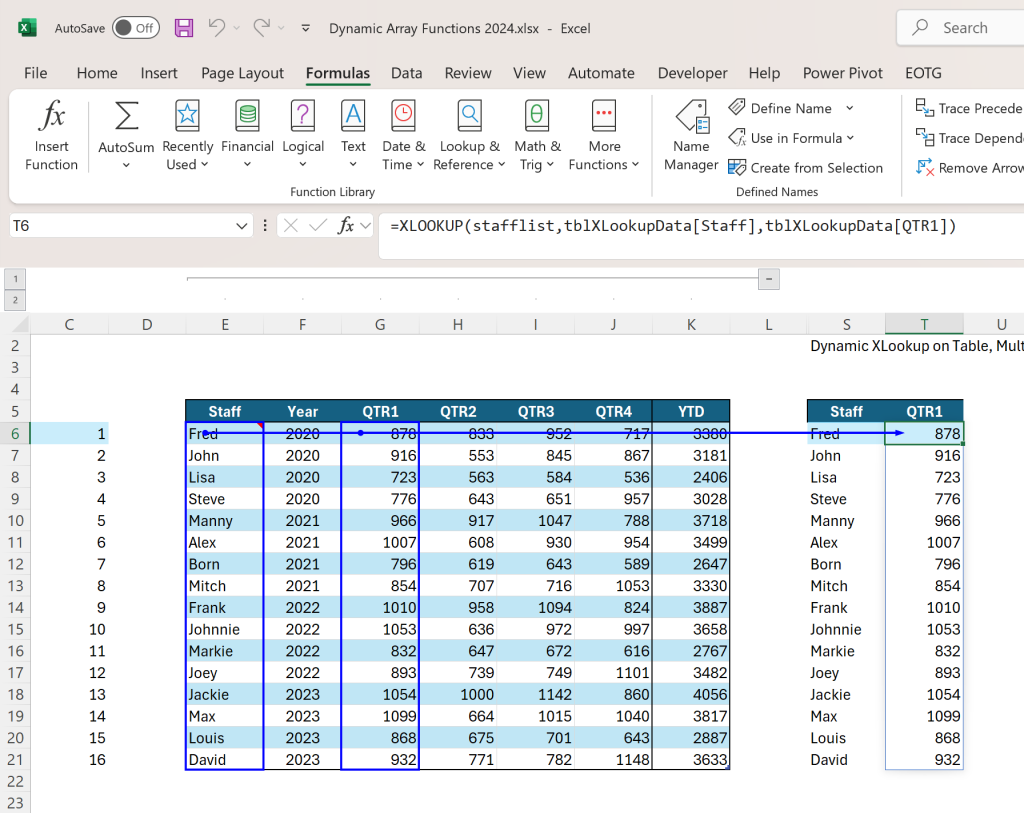
If you use Excel Tables, the XLOOKUP and SUMIFS functions make quick work of it.
Phase 2, Step 7: Dashboards
Pivot Tables, Pivot Charts, Dynamic & Interactive Reports and Analysis
Optional: C-Level Executives LOVE Excel Dashboards. Excel Dashboards almost always have one or more Pivot Tables.
Excel Dashboards allow the user to drilldown into the data, to see the details, to see the summary data, to see the data as they want to see it, on the fly, interactively.
- Pivot Tables
- Power Pivot
- Power Query Pivoted output
- PIVOTBY Function
There is more than one way to Pivot. Which you use depends on the data and on preference. Personally, I use 2-3 of these in each solution, as each works differenetly.
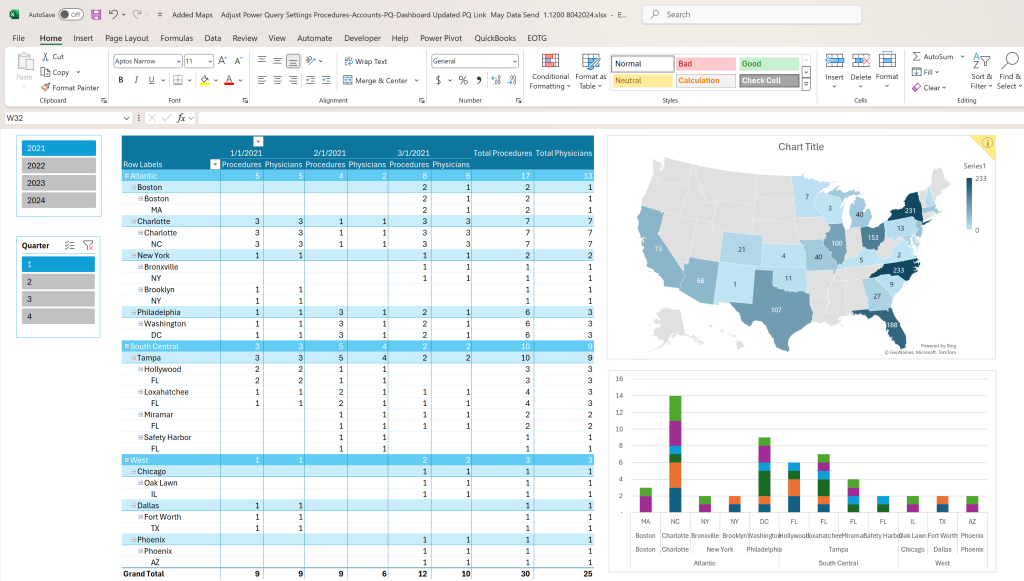
Pivot Tables and Power Pivot are a great way to summarize data. Base them on Power Query data and you have a powerfully automated solution.
Phase 3, Step 7: Code – User Experience
Time to use M-Code, VBA, and OS
Automation is what the clients want. To fully automate a file, you often need to use code, be it VBA or M-Code. The use of code adds power to the solution.
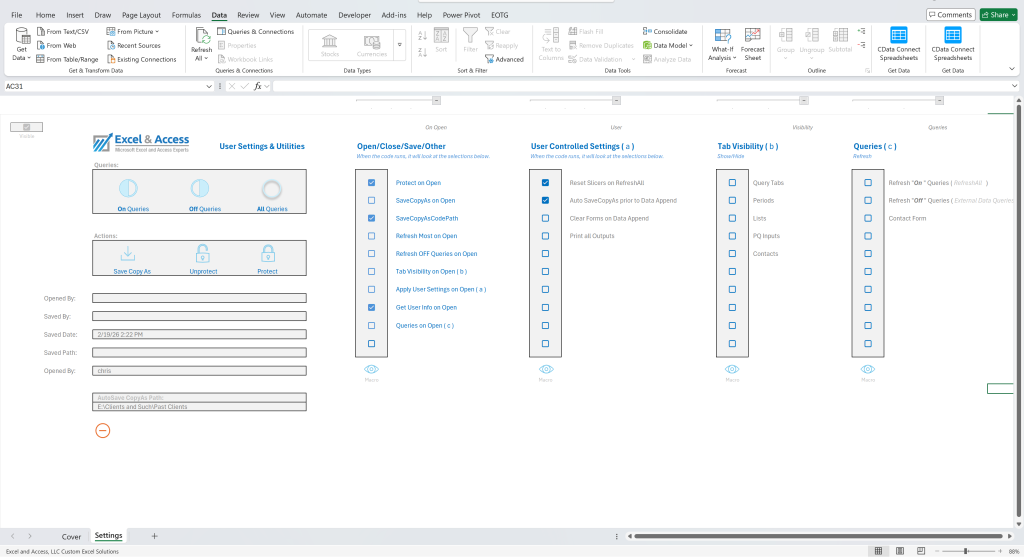
VBA drives the user experience as well as automation.
Conclusion: Excel Data Driven Solutions in 2026
BIG Data or regular data, both solutions are based on the same design principles, other than using the Data Model. Else, they are the same steps. Both start with data. Both start with Excel Tables, add List / Lookup Tables, then those go into Power Query.
Up to that point, both solutions are basically the same. Data starts at the top, and it flows down, through the solution, to the final reports and analysis.
As such, Excel development needs to be FLUID. We need to build solutions that flow. We need to build solutions that take very little, if any effort, by the user. That all comes down to design. And that all starts with the data.
Custom Excel solutions start with the data and they end with the user interface. There are many steps in between.
If you build your solution top down, you will have a more FLUID solution. The data starts at the top, in Tables, goes into Power Query, then the Data Model, and then finally onsheet, for functions to reference.
The degree in which you can automate the file largely depends on design, skill and experience. Use the right tools, the right way, add code, and you can make a fully automated and integrated solution in Excel 365.
FLUID, Data Driven Solutions at Excel and Access, LLC.
Toll-Free: 877.392.3539 | Irvine, California: 949.612.3366 | Manhattan, New York: 646.205.3261
Contact us for a Free Consultation Today

Microsoft, IBM, ADP, etc., have hired Excel and Access, LLC to build custom Excel solutions for their business. Our Excel MVPs do amazing work.

Clients love our work. We love what we do. Perfect match.









Spot on with this! Design is done before the first key is struck on the keyboard. Until you know where you’re going, you don’t even start the spreadsheet.
I like to describe it through three questions:
1) What data do you need?
2) From where does that data come?
3) What do you want to do with your data?
Those three questions drive the structure:
1) The Excel “Database” and Lists page.
2) Automatic (PQ) and manual input mechanisms.
3) Reports and Dashboards.
The upside of the approach you lay out here is that the resulting spreadsheet is more efficient, more flexible (for future growth), and more difficult to break (because data isn’t scattered in random locations).
Exactly.
If you rush the design, or skip that entirely, you will usually find yourself doing a lot of revisions and rework, all which is unnecessary. The sales data for example, comes from one external Table, yet it might endup on 5 or more sheets in the file. So start with the data, at the top, and let it flow like water.
Chris, I really like the way you frame Excel 365 as a platform for building fully automated data-driven solutions rather than just a collection of spreadsheets.
In my own work I’m seeing the same pattern emerge, Power Query for ingestion and transformation, structured tables and relationships for modeling, and then an intuitive UI layer for users. When those pieces are combined properly, Excel becomes much closer to an application than a workbook.
It’s amazing how many organizations still haven’t realized how powerful this architecture can be inside the Microsoft 365 ecosystem.
95% of users have no idea of what Excel can or should do. They manually copy & paste, use Index/Match or the VLOOKUP, etc. They just do not know.
That is where we come in.